
Advertisement
- Sweden
- /
- Capital Markets
- /
- OM:OODA
It's Down 27% But oodash Group AB (publ) (STO:OODA) Could Be Riskier Than It Looks
The oodash Group AB (publ) (STO:OODA) share price has softened a substantial 27% over the previous 30 days, handing back much of the gains the stock has made lately. The recent drop completes a disastrous twelve months for shareholders, who are sitting on a 92% loss during that time.
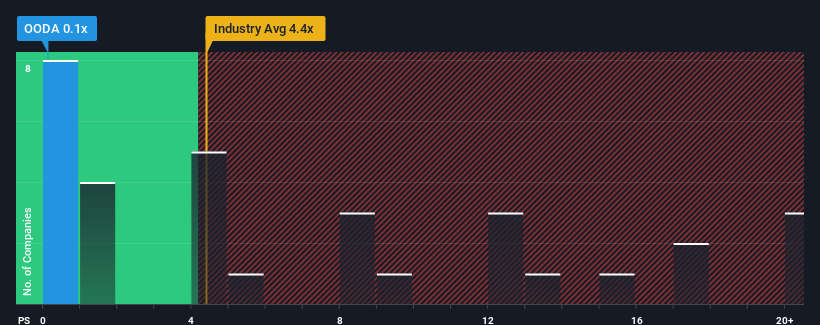
Since its price has dipped substantially, oodash Group's price-to-sales (or "P/S") ratio of 0.1x might make it look like a strong buy right now compared to the wider Capital Markets industry in Sweden, where around half of the companies have P/S ratios above 4.4x and even P/S above 13x are quite common. Nonetheless, we'd need to dig a little deeper to determine if there is a rational basis for the highly reduced P/S.
Check out our latest analysis for oodash Group
How oodash Group Has Been Performing
As an illustration, revenue has deteriorated at oodash Group over the last year, which is not ideal at all. Perhaps the market believes the recent revenue performance isn't good enough to keep up the industry, causing the P/S ratio to suffer. Those who are bullish on oodash Group will be hoping that this isn't the case so that they can pick up the stock at a lower valuation.
We don't have analyst forecasts, but you can see how recent trends are setting up the company for the future by checking out our free report on oodash Group's earnings, revenue and cash flow.Is There Any Revenue Growth Forecasted For oodash Group?
The only time you'd be truly comfortable seeing a P/S as depressed as oodash Group's is when the company's growth is on track to lag the industry decidedly.
In reviewing the last year of financials, we were disheartened to see the company's revenues fell to the tune of 40%. Even so, admirably revenue has lifted 168% in aggregate from three years ago, notwithstanding the last 12 months. Accordingly, while they would have preferred to keep the run going, shareholders would definitely welcome the medium-term rates of revenue growth.
Comparing that recent medium-term revenue trajectory with the industry's one-year growth forecast of 32% shows it's noticeably more attractive.
In light of this, it's peculiar that oodash Group's P/S sits below the majority of other companies. Apparently some shareholders believe the recent performance has exceeded its limits and have been accepting significantly lower selling prices.
What Does oodash Group's P/S Mean For Investors?
Shares in oodash Group have plummeted and its P/S has followed suit. Using the price-to-sales ratio alone to determine if you should sell your stock isn't sensible, however it can be a practical guide to the company's future prospects.
Our examination of oodash Group revealed its three-year revenue trends aren't boosting its P/S anywhere near as much as we would have predicted, given they look better than current industry expectations. When we see robust revenue growth that outpaces the industry, we presume that there are notable underlying risks to the company's future performance, which is exerting downward pressure on the P/S ratio. At least price risks look to be very low if recent medium-term revenue trends continue, but investors seem to think future revenue could see a lot of volatility.
It is also worth noting that we have found 5 warning signs for oodash Group (4 are potentially serious!) that you need to take into consideration.
If you're unsure about the strength of oodash Group's business, why not explore our interactive list of stocks with solid business fundamentals for some other companies you may have missed.
Valuation is complex, but we're here to simplify it.
Discover if oodash Group might be undervalued or overvalued with our detailed analysis, featuring fair value estimates, potential risks, dividends, insider trades, and its financial condition.
Access Free AnalysisHave feedback on this article? Concerned about the content? Get in touch with us directly. Alternatively, email editorial-team (at) simplywallst.com.
This article by Simply Wall St is general in nature. We provide commentary based on historical data and analyst forecasts only using an unbiased methodology and our articles are not intended to be financial advice. It does not constitute a recommendation to buy or sell any stock, and does not take account of your objectives, or your financial situation. We aim to bring you long-term focused analysis driven by fundamental data. Note that our analysis may not factor in the latest price-sensitive company announcements or qualitative material. Simply Wall St has no position in any stocks mentioned.
About OM:OODA
oodash Group
Focuses on artificial intelligence (AI) and software-as-a-service (SaaS) primarily in business intelligence and data security.
Medium-low risk with adequate balance sheet.
Market Insights

Advertisement
Community Narratives
The company that turned a verb into a global necessity and basically runs the modern internet, digital ads, smartphones, maps, and AI.
Fair Value US$300.00|7.5% undervalued
OS
Community Contributor
Flowers Foods Pays A Fair Price For Health
Fair Value US$16.12|25.4% undervalued
NV
Community Contributor
TMX Group will thrive with 33.3% profit margin and enduring market moat
Fair Value CA$49.90|3.6% overvalued
LI
Community Contributor
The "Molecular Pencil": Why Beam's Technology is Built to Win
Fair Value US$65.01|65.0% undervalued
DA
Community Contributor