
Advertisement
- Sweden
- /
- Capital Markets
- /
- OM:K33
Even With A 185% Surge, Cautious Investors Are Not Rewarding K33 AB (publ)'s (STO:K33) Performance Completely
Despite an already strong run, K33 AB (publ) (STO:K33) shares have been powering on, with a gain of 185% in the last thirty days. The last 30 days were the cherry on top of the stock's 571% gain in the last year, which is nothing short of spectacular.
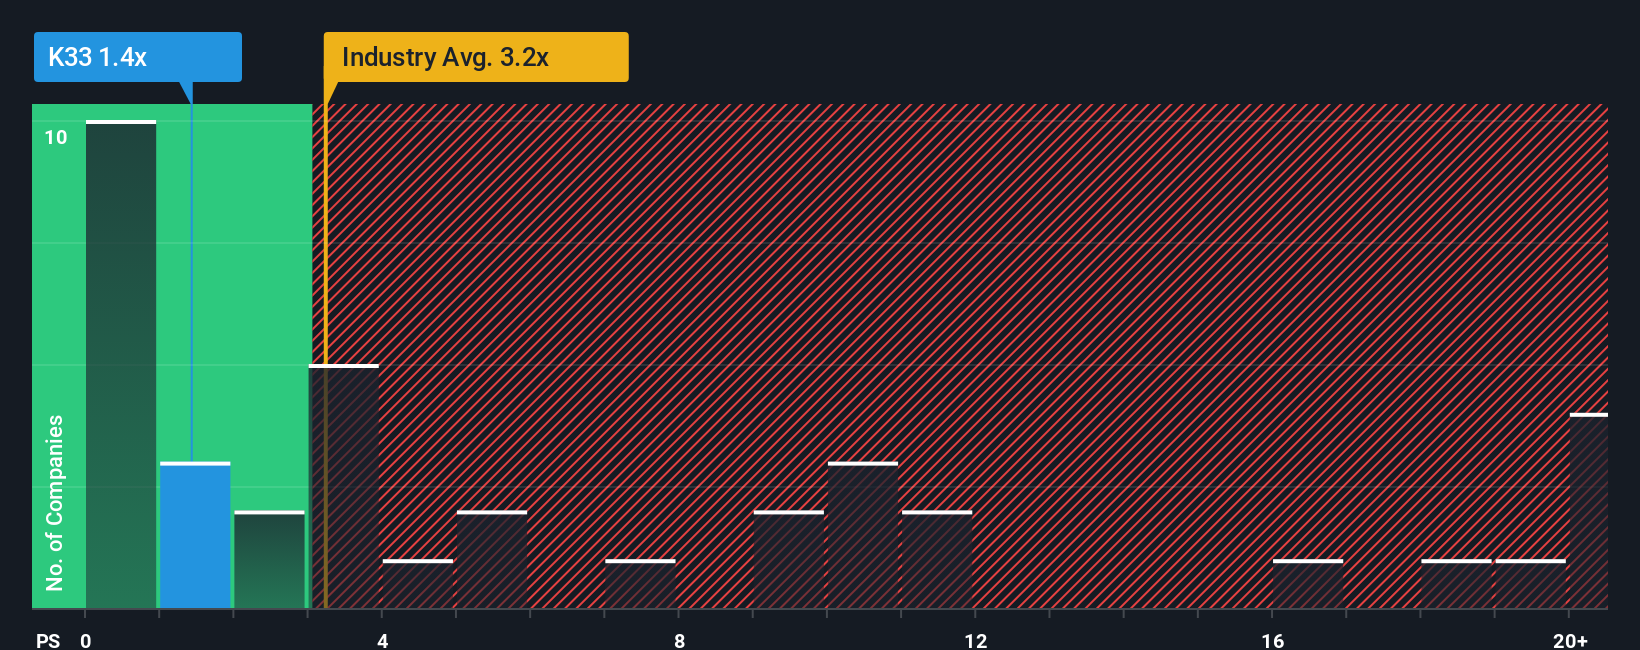
Although its price has surged higher, K33's price-to-sales (or "P/S") ratio of 1.4x might still make it look like a buy right now compared to the Capital Markets industry in Sweden, where around half of the companies have P/S ratios above 3.2x and even P/S above 11x are quite common. Nonetheless, we'd need to dig a little deeper to determine if there is a rational basis for the reduced P/S.
Check out our latest analysis for K33
How K33 Has Been Performing
Recent times have been quite advantageous for K33 as its revenue has been rising very briskly. One possibility is that the P/S ratio is low because investors think this strong revenue growth might actually underperform the broader industry in the near future. Those who are bullish on K33 will be hoping that this isn't the case, so that they can pick up the stock at a lower valuation.
Want the full picture on earnings, revenue and cash flow for the company? Then our free report on K33 will help you shine a light on its historical performance.Do Revenue Forecasts Match The Low P/S Ratio?
There's an inherent assumption that a company should underperform the industry for P/S ratios like K33's to be considered reasonable.
Taking a look back first, we see that the company's revenues underwent some rampant growth over the last 12 months. Pleasingly, revenue has also lifted 189% in aggregate from three years ago, thanks to the last 12 months of explosive growth. Accordingly, shareholders would have definitely welcomed those medium-term rates of revenue growth.
Weighing the recent medium-term upward revenue trajectory against the broader industry's one-year forecast for contraction of 1.0% shows it's a great look while it lasts.
In light of this, it's quite peculiar that K33's P/S sits below the majority of other companies. It looks like most investors are not convinced at all that the company can maintain its recent positive growth rate in the face of a shrinking broader industry.
What We Can Learn From K33's P/S?
K33's stock price has surged recently, but its but its P/S still remains modest. We'd say the price-to-sales ratio's power isn't primarily as a valuation instrument but rather to gauge current investor sentiment and future expectations.
Our examination of K33 revealed that despite growing revenue over the medium-term in a shrinking industry, the P/S doesn't reflect this as it's lower than the industry average. One assumption would be that there are some underlying risks to revenue that are keeping the P/S from rising to match the its strong performance. Amidst challenging industry conditions, perhaps a key concern is whether the company can sustain its superior revenue growth trajectory. While the chance of the share price dropping sharply is fairly remote, investors do seem to be anticipating future revenue instability.
Don't forget that there may be other risks. For instance, we've identified 1 warning sign for K33 that you should be aware of.
If companies with solid past earnings growth is up your alley, you may wish to see this free collection of other companies with strong earnings growth and low P/E ratios.
Valuation is complex, but we're here to simplify it.
Discover if K33 might be undervalued or overvalued with our detailed analysis, featuring fair value estimates, potential risks, dividends, insider trades, and its financial condition.
Access Free AnalysisHave feedback on this article? Concerned about the content? Get in touch with us directly. Alternatively, email editorial-team (at) simplywallst.com.
This article by Simply Wall St is general in nature. We provide commentary based on historical data and analyst forecasts only using an unbiased methodology and our articles are not intended to be financial advice. It does not constitute a recommendation to buy or sell any stock, and does not take account of your objectives, or your financial situation. We aim to bring you long-term focused analysis driven by fundamental data. Note that our analysis may not factor in the latest price-sensitive company announcements or qualitative material. Simply Wall St has no position in any stocks mentioned.
About OM:K33
K33
Through its subsidiaries, invests in digital assets in Sweden and internationally.
Mediocre balance sheet with low risk.
Similar Companies
Market Insights

Advertisement
Community Narratives
MicroVision will explode future revenue by 380.37% with a vision towards success
Fair Value US$60.00|98.4% undervalued
TH
Community Contributor
The Indispensable Artery for a New North American Economy
Fair Value CA$132.87|1.3% undervalued
TI
Community Contributor