
Advertisement
Legendary fund manager Li Lu (who Charlie Munger backed) once said, 'The biggest investment risk is not the volatility of prices, but whether you will suffer a permanent loss of capital.' It's only natural to consider a company's balance sheet when you examine how risky it is, since debt is often involved when a business collapses. We can see that Kambi Group plc (STO:KAMBI) does use debt in its business. But the more important question is: how much risk is that debt creating?
Why Does Debt Bring Risk?
Debt assists a business until the business has trouble paying it off, either with new capital or with free cash flow. If things get really bad, the lenders can take control of the business. However, a more usual (but still expensive) situation is where a company must dilute shareholders at a cheap share price simply to get debt under control. By replacing dilution, though, debt can be an extremely good tool for businesses that need capital to invest in growth at high rates of return. When we think about a company's use of debt, we first look at cash and debt together.
See our latest analysis for Kambi Group
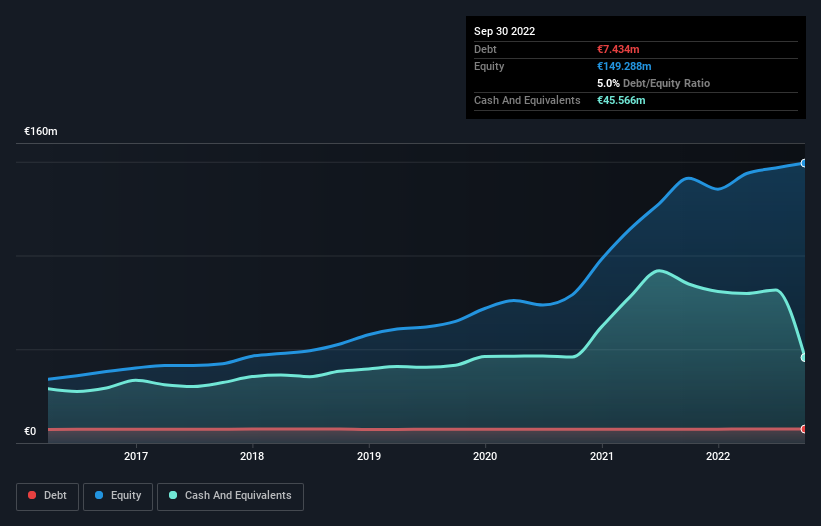
How Much Debt Does Kambi Group Carry?
As you can see below, Kambi Group had €7.43m of debt, at September 2022, which is about the same as the year before. You can click the chart for greater detail. However, its balance sheet shows it holds €45.6m in cash, so it actually has €38.1m net cash.
How Healthy Is Kambi Group's Balance Sheet?
We can see from the most recent balance sheet that Kambi Group had liabilities of €29.7m falling due within a year, and liabilities of €58.7m due beyond that. Offsetting these obligations, it had cash of €45.6m as well as receivables valued at €40.4m due within 12 months. So its liabilities outweigh the sum of its cash and (near-term) receivables by €2.44m.
Having regard to Kambi Group's size, it seems that its liquid assets are well balanced with its total liabilities. So while it's hard to imagine that the €476.9m company is struggling for cash, we still think it's worth monitoring its balance sheet. While it does have liabilities worth noting, Kambi Group also has more cash than debt, so we're pretty confident it can manage its debt safely.
It is just as well that Kambi Group's load is not too heavy, because its EBIT was down 71% over the last year. When a company sees its earnings tank, it can sometimes find its relationships with its lenders turn sour. When analysing debt levels, the balance sheet is the obvious place to start. But it is future earnings, more than anything, that will determine Kambi Group's ability to maintain a healthy balance sheet going forward. So if you're focused on the future you can check out this free report showing analyst profit forecasts.
Finally, while the tax-man may adore accounting profits, lenders only accept cold hard cash. While Kambi Group has net cash on its balance sheet, it's still worth taking a look at its ability to convert earnings before interest and tax (EBIT) to free cash flow, to help us understand how quickly it is building (or eroding) that cash balance. During the last three years, Kambi Group produced sturdy free cash flow equating to 67% of its EBIT, about what we'd expect. This cold hard cash means it can reduce its debt when it wants to.
Summing Up
While it is always sensible to look at a company's total liabilities, it is very reassuring that Kambi Group has €38.1m in net cash. The cherry on top was that in converted 67% of that EBIT to free cash flow, bringing in €11m. So we are not troubled with Kambi Group's debt use. When analysing debt levels, the balance sheet is the obvious place to start. However, not all investment risk resides within the balance sheet - far from it. For instance, we've identified 1 warning sign for Kambi Group that you should be aware of.
Of course, if you're the type of investor who prefers buying stocks without the burden of debt, then don't hesitate to discover our exclusive list of net cash growth stocks, today.
Valuation is complex, but we're here to simplify it.
Discover if Kambi Group might be undervalued or overvalued with our detailed analysis, featuring fair value estimates, potential risks, dividends, insider trades, and its financial condition.
Access Free AnalysisHave feedback on this article? Concerned about the content? Get in touch with us directly. Alternatively, email editorial-team (at) simplywallst.com.
This article by Simply Wall St is general in nature. We provide commentary based on historical data and analyst forecasts only using an unbiased methodology and our articles are not intended to be financial advice. It does not constitute a recommendation to buy or sell any stock, and does not take account of your objectives, or your financial situation. We aim to bring you long-term focused analysis driven by fundamental data. Note that our analysis may not factor in the latest price-sensitive company announcements or qualitative material. Simply Wall St has no position in any stocks mentioned.
About OM:KAMBI
Kambi Group
Provides sports betting technology and services to the betting and gaming industry in Europe, the Americas, and internationally.
Flawless balance sheet with reasonable growth potential.
Similar Companies
Market Insights

Advertisement
Community Narratives
The company that turned a verb into a global necessity and basically runs the modern internet, digital ads, smartphones, maps, and AI.
Fair Value US$300.00|5.4% undervalued
OS
Community Contributor
Flowers Foods Pays A Fair Price For Health
Fair Value US$16.12|26.3% undervalued
NV
Community Contributor
TMX Group will thrive with 33.3% profit margin and enduring market moat
Fair Value CA$49.90|4.1% overvalued
LI
Community Contributor
The "Molecular Pencil": Why Beam's Technology is Built to Win
Fair Value US$65.01|62.7% undervalued
DA
Community Contributor