- Sweden
- /
- Hospitality
- /
- OM:EVO
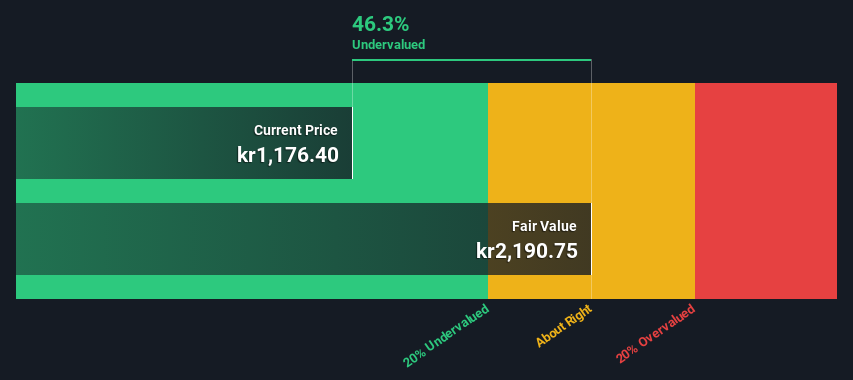
An Intrinsic Calculation For Evolution AB (publ) (STO:EVO) Suggests It's 46% Undervalued


Key Insights
- The projected fair value for Evolution is kr2,191 based on 2 Stage Free Cash Flow to Equity
- Evolution's kr1,176 share price signals that it might be 46% undervalued
- Our fair value estimate is 64% higher than Evolution's analyst price target of €1,332
In this article we are going to estimate the intrinsic value of Evolution AB (publ) (STO:EVO) by taking the expected future cash flows and discounting them to their present value. One way to achieve this is by employing the Discounted Cash Flow (DCF) model. It may sound complicated, but actually it is quite simple!
We generally believe that a company's value is the present value of all of the cash it will generate in the future. However, a DCF is just one valuation metric among many, and it is not without flaws. If you want to learn more about discounted cash flow, the rationale behind this calculation can be read in detail in the Simply Wall St analysis model.
View our latest analysis for Evolution
The Calculation
We use what is known as a 2-stage model, which simply means we have two different periods of growth rates for the company's cash flows. Generally the first stage is higher growth, and the second stage is a lower growth phase. To begin with, we have to get estimates of the next ten years of cash flows. Where possible we use analyst estimates, but when these aren't available we extrapolate the previous free cash flow (FCF) from the last estimate or reported value. We assume companies with shrinking free cash flow will slow their rate of shrinkage, and that companies with growing free cash flow will see their growth rate slow, over this period. We do this to reflect that growth tends to slow more in the early years than it does in later years.
A DCF is all about the idea that a dollar in the future is less valuable than a dollar today, so we need to discount the sum of these future cash flows to arrive at a present value estimate:
10-year free cash flow (FCF) estimate
| 2024 | 2025 | 2026 | 2027 | 2028 | 2029 | 2030 | 2031 | 2032 | 2033 | |
| Levered FCF (€, Millions) | €1.17b | €1.38b | €1.59b | €1.89b | €2.10b | €2.27b | €2.40b | €2.50b | €2.59b | €2.65b |
| Growth Rate Estimate Source | Analyst x6 | Analyst x6 | Analyst x2 | Analyst x1 | Est @ 11.19% | Est @ 8.07% | Est @ 5.88% | Est @ 4.35% | Est @ 3.28% | Est @ 2.53% |
| Present Value (€, Millions) Discounted @ 6.2% | €1.1k | €1.2k | €1.3k | €1.5k | €1.6k | €1.6k | €1.6k | €1.6k | €1.5k | €1.5k |
("Est" = FCF growth rate estimated by Simply Wall St)
Present Value of 10-year Cash Flow (PVCF) = €14b
After calculating the present value of future cash flows in the initial 10-year period, we need to calculate the Terminal Value, which accounts for all future cash flows beyond the first stage. For a number of reasons a very conservative growth rate is used that cannot exceed that of a country's GDP growth. In this case we have used the 5-year average of the 10-year government bond yield (0.8%) to estimate future growth. In the same way as with the 10-year 'growth' period, we discount future cash flows to today's value, using a cost of equity of 6.2%.
Terminal Value (TV)= FCF2033 × (1 + g) ÷ (r – g) = €2.7b× (1 + 0.8%) ÷ (6.2%– 0.8%) = €50b
Present Value of Terminal Value (PVTV)= TV / (1 + r)10= €50b÷ ( 1 + 6.2%)10= €27b
The total value, or equity value, is then the sum of the present value of the future cash flows, which in this case is €42b. To get the intrinsic value per share, we divide this by the total number of shares outstanding. Compared to the current share price of kr1.2k, the company appears quite good value at a 46% discount to where the stock price trades currently. Remember though, that this is just an approximate valuation, and like any complex formula - garbage in, garbage out.
The Assumptions
The calculation above is very dependent on two assumptions. The first is the discount rate and the other is the cash flows. If you don't agree with these result, have a go at the calculation yourself and play with the assumptions. The DCF also does not consider the possible cyclicality of an industry, or a company's future capital requirements, so it does not give a full picture of a company's potential performance. Given that we are looking at Evolution as potential shareholders, the cost of equity is used as the discount rate, rather than the cost of capital (or weighted average cost of capital, WACC) which accounts for debt. In this calculation we've used 6.2%, which is based on a levered beta of 1.077. Beta is a measure of a stock's volatility, compared to the market as a whole. We get our beta from the industry average beta of globally comparable companies, with an imposed limit between 0.8 and 2.0, which is a reasonable range for a stable business.
SWOT Analysis for Evolution
- Currently debt free.
- Dividends are covered by earnings and cash flows.
- Earnings growth over the past year underperformed the Hospitality industry.
- Dividend is low compared to the top 25% of dividend payers in the Hospitality market.
- Annual revenue is forecast to grow faster than the Swedish market.
- Trading below our estimate of fair value by more than 20%.
- Significant insider buying over the past 3 months.
- Annual earnings are forecast to grow slower than the Swedish market.
Next Steps:
Whilst important, the DCF calculation ideally won't be the sole piece of analysis you scrutinize for a company. DCF models are not the be-all and end-all of investment valuation. Rather it should be seen as a guide to "what assumptions need to be true for this stock to be under/overvalued?" For example, changes in the company's cost of equity or the risk free rate can significantly impact the valuation. Can we work out why the company is trading at a discount to intrinsic value? For Evolution, we've put together three fundamental elements you should explore:
- Risks: Take risks, for example - Evolution has 1 warning sign we think you should be aware of.
- Management:Have insiders been ramping up their shares to take advantage of the market's sentiment for EVO's future outlook? Check out our management and board analysis with insights on CEO compensation and governance factors.
- Other Solid Businesses: Low debt, high returns on equity and good past performance are fundamental to a strong business. Why not explore our interactive list of stocks with solid business fundamentals to see if there are other companies you may not have considered!
PS. The Simply Wall St app conducts a discounted cash flow valuation for every stock on the OM every day. If you want to find the calculation for other stocks just search here.
Valuation is complex, but we're here to simplify it.
Discover if Evolution might be undervalued or overvalued with our detailed analysis, featuring fair value estimates, potential risks, dividends, insider trades, and its financial condition.
Access Free AnalysisHave feedback on this article? Concerned about the content? Get in touch with us directly. Alternatively, email editorial-team (at) simplywallst.com.
This article by Simply Wall St is general in nature. We provide commentary based on historical data and analyst forecasts only using an unbiased methodology and our articles are not intended to be financial advice. It does not constitute a recommendation to buy or sell any stock, and does not take account of your objectives, or your financial situation. We aim to bring you long-term focused analysis driven by fundamental data. Note that our analysis may not factor in the latest price-sensitive company announcements or qualitative material. Simply Wall St has no position in any stocks mentioned.
About OM:EVO
Evolution
Develops, produces, markets, and licenses online casino systems to gaming operators in Europe, Asia, North America, Latin America, and internationally.
Flawless balance sheet and undervalued.

