
Advertisement
Howard Marks put it nicely when he said that, rather than worrying about share price volatility, 'The possibility of permanent loss is the risk I worry about... and every practical investor I know worries about.' So it might be obvious that you need to consider debt, when you think about how risky any given stock is, because too much debt can sink a company. As with many other companies Acroud AB (publ) (STO:ACROUD) makes use of debt. But the more important question is: how much risk is that debt creating?
Why Does Debt Bring Risk?
Debt assists a business until the business has trouble paying it off, either with new capital or with free cash flow. Ultimately, if the company can't fulfill its legal obligations to repay debt, shareholders could walk away with nothing. However, a more usual (but still expensive) situation is where a company must dilute shareholders at a cheap share price simply to get debt under control. Of course, debt can be an important tool in businesses, particularly capital heavy businesses. When we examine debt levels, we first consider both cash and debt levels, together.
View our latest analysis for Acroud
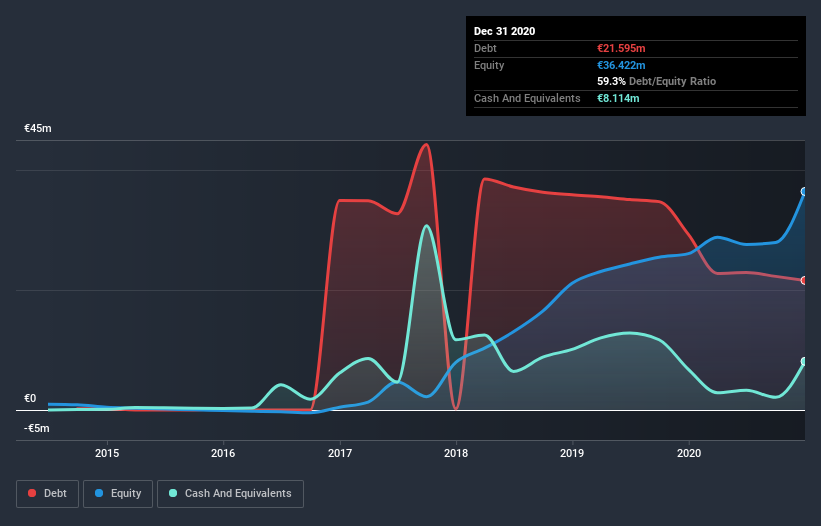
What Is Acroud's Debt?
You can click the graphic below for the historical numbers, but it shows that Acroud had €21.6m of debt in December 2020, down from €29.3m, one year before. On the flip side, it has €8.11m in cash leading to net debt of about €13.5m.
A Look At Acroud's Liabilities
We can see from the most recent balance sheet that Acroud had liabilities of €2.88m falling due within a year, and liabilities of €21.8m due beyond that. On the other hand, it had cash of €8.11m and €2.09m worth of receivables due within a year. So it has liabilities totalling €14.4m more than its cash and near-term receivables, combined.
While this might seem like a lot, it is not so bad since Acroud has a market capitalization of €43.6m, and so it could probably strengthen its balance sheet by raising capital if it needed to. However, it is still worthwhile taking a close look at its ability to pay off debt.
In order to size up a company's debt relative to its earnings, we calculate its net debt divided by its earnings before interest, tax, depreciation, and amortization (EBITDA) and its earnings before interest and tax (EBIT) divided by its interest expense (its interest cover). This way, we consider both the absolute quantum of the debt, as well as the interest rates paid on it.
While we wouldn't worry about Acroud's net debt to EBITDA ratio of 2.7, we think its super-low interest cover of 2.1 times is a sign of high leverage. So shareholders should probably be aware that interest expenses appear to have really impacted the business lately. Worse, Acroud's EBIT was down 48% over the last year. If earnings continue to follow that trajectory, paying off that debt load will be harder than convincing us to run a marathon in the rain. When analysing debt levels, the balance sheet is the obvious place to start. But it is Acroud's earnings that will influence how the balance sheet holds up in the future. So when considering debt, it's definitely worth looking at the earnings trend. Click here for an interactive snapshot.
Finally, while the tax-man may adore accounting profits, lenders only accept cold hard cash. So the logical step is to look at the proportion of that EBIT that is matched by actual free cash flow. During the last three years, Acroud produced sturdy free cash flow equating to 70% of its EBIT, about what we'd expect. This free cash flow puts the company in a good position to pay down debt, when appropriate.
Our View
While Acroud's interest cover makes us cautious about it, its track record of (not) growing its EBIT is no better. But at least its conversion of EBIT to free cash flow is a gleaming silver lining to those clouds. When we consider all the factors discussed, it seems to us that Acroud is taking some risks with its use of debt. So while that leverage does boost returns on equity, we wouldn't really want to see it increase from here. There's no doubt that we learn most about debt from the balance sheet. However, not all investment risk resides within the balance sheet - far from it. Be aware that Acroud is showing 5 warning signs in our investment analysis , and 2 of those are a bit unpleasant...
If you're interested in investing in businesses that can grow profits without the burden of debt, then check out this free list of growing businesses that have net cash on the balance sheet.
If you’re looking to trade Acroud, open an account with the lowest-cost* platform trusted by professionals, Interactive Brokers. Their clients from over 200 countries and territories trade stocks, options, futures, forex, bonds and funds worldwide from a single integrated account. Promoted
New: Manage All Your Stock Portfolios in One Place
We've created the ultimate portfolio companion for stock investors, and it's free.
• Connect an unlimited number of Portfolios and see your total in one currency
• Be alerted to new Warning Signs or Risks via email or mobile
• Track the Fair Value of your stocks
This article by Simply Wall St is general in nature. It does not constitute a recommendation to buy or sell any stock, and does not take account of your objectives, or your financial situation. We aim to bring you long-term focused analysis driven by fundamental data. Note that our analysis may not factor in the latest price-sensitive company announcements or qualitative material. Simply Wall St has no position in any stocks mentioned.
*Interactive Brokers Rated Lowest Cost Broker by StockBrokers.com Annual Online Review 2020
Have feedback on this article? Concerned about the content? Get in touch with us directly. Alternatively, email editorial-team (at) simplywallst.com.
About OM:ACROUD
Acroud
Engages in the development and operation of Software as a Service (SaaS) solutions in Sweden.
Adequate balance sheet with slight risk.
Similar Companies
Market Insights

Advertisement
Community Narratives
MicroVision will explode future revenue by 380.37% with a vision towards success
Fair Value US$60.00|98.4% undervalued
TH
Community Contributor
The Indispensable Artery for a New North American Economy
Fair Value CA$132.87|1.1% undervalued
TI
Community Contributor