- Sweden
- /
- Consumer Durables
- /
- OM:NOBI
Investors in Nobia (STO:NOBI) have unfortunately lost 81% over the last five years


We're definitely into long term investing, but some companies are simply bad investments over any time frame. We don't wish catastrophic capital loss on anyone. For example, we sympathize with anyone who was caught holding Nobia AB (publ) (STO:NOBI) during the five years that saw its share price drop a whopping 84%. We also note that the stock has performed poorly over the last year, with the share price down 55%. Shareholders have had an even rougher run lately, with the share price down 18% in the last 90 days. We note that the company has reported results fairly recently; and the market is hardly delighted. You can check out the latest numbers in our company report. We really hope anyone holding through that price crash has a diversified portfolio. Even when you lose money, you don't have to lose the lesson.
So let's have a look and see if the longer term performance of the company has been in line with the underlying business' progress.
Check out our latest analysis for Nobia
While the efficient markets hypothesis continues to be taught by some, it has been proven that markets are over-reactive dynamic systems, and investors are not always rational. One flawed but reasonable way to assess how sentiment around a company has changed is to compare the earnings per share (EPS) with the share price.
In the last half decade Nobia saw its share price fall as its EPS declined below zero. At present it's hard to make valid comparisons between EPS and the share price. However, we can say we'd expect to see a falling share price in this scenario.
The company's earnings per share (over time) is depicted in the image below (click to see the exact numbers).
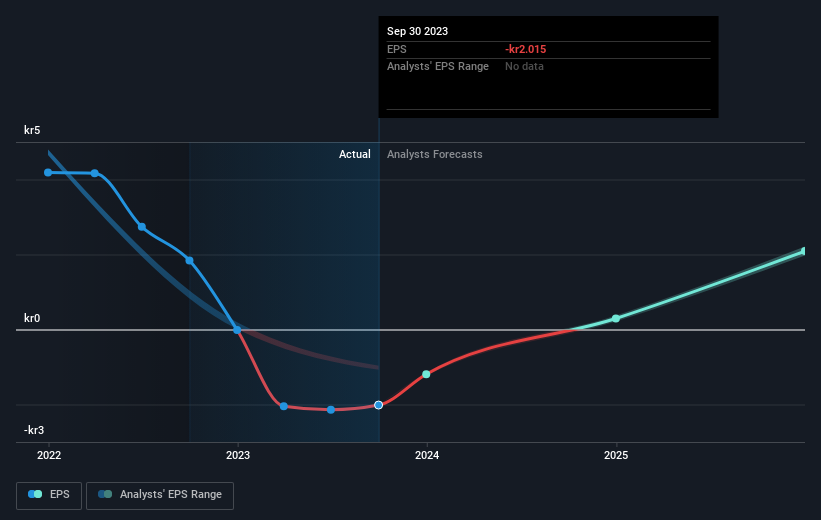
It might be well worthwhile taking a look at our free report on Nobia's earnings, revenue and cash flow.
What About The Total Shareholder Return (TSR)?
We'd be remiss not to mention the difference between Nobia's total shareholder return (TSR) and its share price return. Arguably the TSR is a more complete return calculation because it accounts for the value of dividends (as if they were reinvested), along with the hypothetical value of any discounted capital that have been offered to shareholders. Dividends have been really beneficial for Nobia shareholders, and that cash payout explains why its total shareholder loss of 81%, over the last 5 years, isn't as bad as the share price return.
A Different Perspective
While the broader market gained around 5.5% in the last year, Nobia shareholders lost 55%. However, keep in mind that even the best stocks will sometimes underperform the market over a twelve month period. Unfortunately, last year's performance may indicate unresolved challenges, given that it was worse than the annualised loss of 13% over the last half decade. We realise that Baron Rothschild has said investors should "buy when there is blood on the streets", but we caution that investors should first be sure they are buying a high quality business. I find it very interesting to look at share price over the long term as a proxy for business performance. But to truly gain insight, we need to consider other information, too. Take risks, for example - Nobia has 1 warning sign we think you should be aware of.
But note: Nobia may not be the best stock to buy. So take a peek at this free list of interesting companies with past earnings growth (and further growth forecast).
Please note, the market returns quoted in this article reflect the market weighted average returns of stocks that currently trade on Swedish exchanges.
Valuation is complex, but we're here to simplify it.
Discover if Nobia might be undervalued or overvalued with our detailed analysis, featuring fair value estimates, potential risks, dividends, insider trades, and its financial condition.
Access Free AnalysisHave feedback on this article? Concerned about the content? Get in touch with us directly. Alternatively, email editorial-team (at) simplywallst.com.
This article by Simply Wall St is general in nature. We provide commentary based on historical data and analyst forecasts only using an unbiased methodology and our articles are not intended to be financial advice. It does not constitute a recommendation to buy or sell any stock, and does not take account of your objectives, or your financial situation. We aim to bring you long-term focused analysis driven by fundamental data. Note that our analysis may not factor in the latest price-sensitive company announcements or qualitative material. Simply Wall St has no position in any stocks mentioned.
About OM:NOBI
Nobia
Engages in the development, manufacture, and sale of kitchen solutions in Sweden, Denmark, Norway, Finland, the United Kingdom, Germany, Netherlands, Austria, Iceland, and internationally.
Undervalued with moderate growth potential.
