
Advertisement
The Returns On Capital At Nilörngruppen (STO:NIL B) Don't Inspire Confidence
There are a few key trends to look for if we want to identify the next multi-bagger. Ideally, a business will show two trends; firstly a growing return on capital employed (ROCE) and secondly, an increasing amount of capital employed. Basically this means that a company has profitable initiatives that it can continue to reinvest in, which is a trait of a compounding machine. Looking at Nilörngruppen (STO:NIL B), it does have a high ROCE right now, but lets see how returns are trending.
Understanding Return On Capital Employed (ROCE)
If you haven't worked with ROCE before, it measures the 'return' (pre-tax profit) a company generates from capital employed in its business. The formula for this calculation on Nilörngruppen is:
Return on Capital Employed = Earnings Before Interest and Tax (EBIT) ÷ (Total Assets - Current Liabilities)
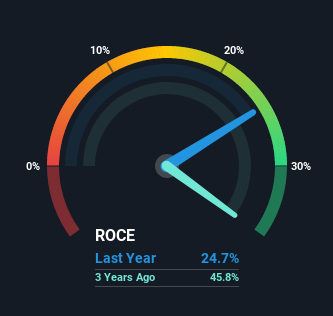
0.25 = kr67m ÷ (kr465m - kr196m) (Based on the trailing twelve months to March 2021).
So, Nilörngruppen has an ROCE of 25%. In absolute terms that's a great return and it's even better than the Luxury industry average of 10%.
Check out our latest analysis for Nilörngruppen
In the above chart we have measured Nilörngruppen's prior ROCE against its prior performance, but the future is arguably more important. If you're interested, you can view the analysts predictions in our free report on analyst forecasts for the company.
What Can We Tell From Nilörngruppen's ROCE Trend?
On the surface, the trend of ROCE at Nilörngruppen doesn't inspire confidence. Historically returns on capital were even higher at 46%, but they have dropped over the last five years. On the other hand, the company has been employing more capital without a corresponding improvement in sales in the last year, which could suggest these investments are longer term plays. It's worth keeping an eye on the company's earnings from here on to see if these investments do end up contributing to the bottom line.
On a separate but related note, it's important to know that Nilörngruppen has a current liabilities to total assets ratio of 42%, which we'd consider pretty high. This effectively means that suppliers (or short-term creditors) are funding a large portion of the business, so just be aware that this can introduce some elements of risk. Ideally we'd like to see this reduce as that would mean fewer obligations bearing risks.
The Bottom Line
To conclude, we've found that Nilörngruppen is reinvesting in the business, but returns have been falling. Although the market must be expecting these trends to improve because the stock has gained 88% over the last five years. But if the trajectory of these underlying trends continue, we think the likelihood of it being a multi-bagger from here isn't high.
One more thing to note, we've identified 3 warning signs with Nilörngruppen and understanding them should be part of your investment process.
Nilörngruppen is not the only stock earning high returns. If you'd like to see more, check out our free list of companies earning high returns on equity with solid fundamentals.
When trading Nilörngruppen or any other investment, use the platform considered by many to be the Professional's Gateway to the Worlds Market, Interactive Brokers. You get the lowest-cost* trading on stocks, options, futures, forex, bonds and funds worldwide from a single integrated account. Promoted
Valuation is complex, but we're here to simplify it.
Discover if Nilörngruppen might be undervalued or overvalued with our detailed analysis, featuring fair value estimates, potential risks, dividends, insider trades, and its financial condition.
Access Free AnalysisThis article by Simply Wall St is general in nature. It does not constitute a recommendation to buy or sell any stock, and does not take account of your objectives, or your financial situation. We aim to bring you long-term focused analysis driven by fundamental data. Note that our analysis may not factor in the latest price-sensitive company announcements or qualitative material. Simply Wall St has no position in any stocks mentioned.
*Interactive Brokers Rated Lowest Cost Broker by StockBrokers.com Annual Online Review 2020
Have feedback on this article? Concerned about the content? Get in touch with us directly. Alternatively, email editorial-team (at) simplywallst.com.
About OM:NIL B
Nilörngruppen
Engages in the production and sale of labels, packaging products, and accessories for the fashion and apparel industries in Sweden, the rest of Europe, and Asia.
Flawless balance sheet and undervalued.
Similar Companies
Market Insights

Advertisement
Weekly Picks
FA

FAI on Arabian Internet and Communication Services ·
Solutions by stc: 34% Upside in Saudi's Digital Transformation Leader
Fair Value:ر.س342.2335.5% undervalued
10 followersusers have followed this narrative
1 commentusers have commented on this narrative
4 likesusers have liked this narrative
RO


RobertoAllende on NVIDIA ·
The AI Infrastructure Giant Grows Into Its Valuation
Fair Value:US$345.0747.9% undervalued
28 followersusers have followed this narrative
28 commentsusers have commented on this narrative
21 likesusers have liked this narrative
Recently Updated Narratives
TA

Talos on NVIDIA ·
Not a Bubble, But the "Industrial Revolution 4.0" Engine
Fair Value:US$294.9239.0% undervalued
1 followerusers have followed this narrative
0 commentsusers have commented on this narrative
0 likesusers have liked this narrative
TA

Talos on Advanced Micro Devices ·
The "David vs. Goliath" AI Trade – Why Second Place is Worth Billions
Fair Value:US$416.4647.2% undervalued
2 followersusers have followed this narrative
0 commentsusers have commented on this narrative
0 likesusers have liked this narrative
TA

Talos on PayPal Holdings ·
The "Sleeping Giant" Wakes Up – Efficiency & Monetization
Fair Value:US$174.9264.2% undervalued
5 followersusers have followed this narrative
0 commentsusers have commented on this narrative
0 likesusers have liked this narrative
Popular Narratives
TH


TheWallstreetKing on MicroVision ·
MicroVision will explode future revenue by 380.37% with a vision towards success
Fair Value:US$6098.6% undervalued
111 followersusers have followed this narrative
11 commentsusers have commented on this narrative
22 likesusers have liked this narrative
AN

AnalystConsensusTarget on NVIDIA ·
NVDA: Expanding AI Demand Will Drive Major Data Center Investments Through 2026
Fair Value:US$250.3928.1% undervalued
945 followersusers have followed this narrative
6 commentsusers have commented on this narrative
24 likesusers have liked this narrative
OS


oscargarcia on Alphabet ·
The company that turned a verb into a global necessity and basically runs the modern internet, digital ads, smartphones, maps, and AI.
Fair Value:US$3407.4% undervalued
146 followersusers have followed this narrative
6 commentsusers have commented on this narrative
18 likesusers have liked this narrative