- Sweden
- /
- Consumer Durables
- /
- NGM:ZENZIP B
Zenergy AB (publ) (NGM:ZENZIP B) Stock's 43% Dive Might Signal An Opportunity But It Requires Some Scrutiny
Zenergy AB (publ) (NGM:ZENZIP B) shareholders that were waiting for something to happen have been dealt a blow with a 43% share price drop in the last month. For any long-term shareholders, the last month ends a year to forget by locking in a 76% share price decline.
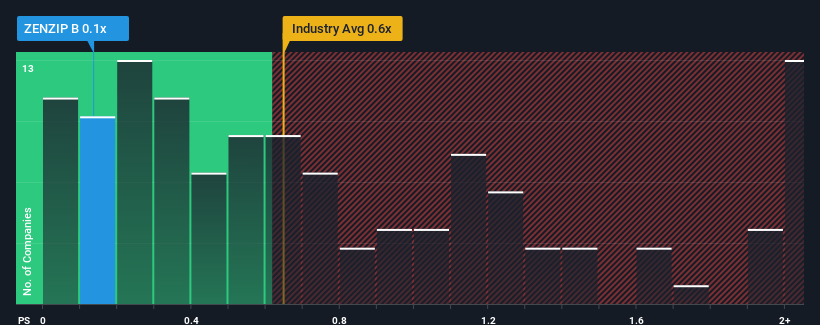
After such a large drop in price, given about half the companies operating in Sweden's Consumer Durables industry have price-to-sales ratios (or "P/S") above 0.7x, you may consider Zenergy as an attractive investment with its 0.1x P/S ratio. Although, it's not wise to just take the P/S at face value as there may be an explanation why it's limited.
Check out our latest analysis for Zenergy

What Does Zenergy's Recent Performance Look Like?
Zenergy certainly has been doing a great job lately as it's been growing its revenue at a really rapid pace. It might be that many expect the strong revenue performance to degrade substantially, which has repressed the P/S ratio. If you like the company, you'd be hoping this isn't the case so that you could potentially pick up some stock while it's out of favour.
We don't have analyst forecasts, but you can see how recent trends are setting up the company for the future by checking out our free report on Zenergy's earnings, revenue and cash flow.Is There Any Revenue Growth Forecasted For Zenergy?
There's an inherent assumption that a company should underperform the industry for P/S ratios like Zenergy's to be considered reasonable.
Retrospectively, the last year delivered an exceptional 126% gain to the company's top line. This great performance means it was also able to deliver immense revenue growth over the last three years. Therefore, it's fair to say the revenue growth recently has been superb for the company.
Comparing that to the industry, which is predicted to shrink 9.7% in the next 12 months, the company's positive momentum based on recent medium-term revenue results is a bright spot for the moment.
With this information, we find it very odd that Zenergy is trading at a P/S lower than the industry. It looks like most investors are not convinced at all that the company can maintain its recent positive growth rate in the face of a shrinking broader industry.
The Bottom Line On Zenergy's P/S
Zenergy's recently weak share price has pulled its P/S back below other Consumer Durables companies. While the price-to-sales ratio shouldn't be the defining factor in whether you buy a stock or not, it's quite a capable barometer of revenue expectations.
Upon analysing the past data, we see it is unexpected that Zenergy is currently trading at a lower P/S than the rest of the industry given that its revenue growth in the past three-year years is exceeding expectations in a challenging industry. There could be some major unobserved threats to revenue preventing the P/S ratio from matching this positive performance. The most obvious risk is that its revenue trajectory may not keep outperforming under these tough industry conditions. It appears many are indeed anticipating revenue instability, because this relative performance should normally provide a boost to the share price.
There are also other vital risk factors to consider before investing and we've discovered 2 warning signs for Zenergy that you should be aware of.
If companies with solid past earnings growth is up your alley, you may wish to see this free collection of other companies with strong earnings growth and low P/E ratios.
Valuation is complex, but we're here to simplify it.
Discover if Zenergy might be undervalued or overvalued with our detailed analysis, featuring fair value estimates, potential risks, dividends, insider trades, and its financial condition.
Access Free AnalysisHave feedback on this article? Concerned about the content? Get in touch with us directly. Alternatively, email editorial-team (at) simplywallst.com.
This article by Simply Wall St is general in nature. We provide commentary based on historical data and analyst forecasts only using an unbiased methodology and our articles are not intended to be financial advice. It does not constitute a recommendation to buy or sell any stock, and does not take account of your objectives, or your financial situation. We aim to bring you long-term focused analysis driven by fundamental data. Note that our analysis may not factor in the latest price-sensitive company announcements or qualitative material. Simply Wall St has no position in any stocks mentioned.
About NGM:ZENZIP B
Zenergy
Zenergy AB (publ) undertakes housing and ZIP contracts in Sweden.
Excellent balance sheet slight.
Market Insights
Community Narratives


