- Sweden
- /
- Construction
- /
- OM:PEAB B
Peab (STO:PEAB B) jumps 4.1% this week, though earnings growth is still tracking behind one-year shareholder returns


These days it's easy to simply buy an index fund, and your returns should (roughly) match the market. But one can do better than that by picking better than average stocks (as part of a diversified portfolio). To wit, the Peab AB (publ) (STO:PEAB B) share price is 46% higher than it was a year ago, much better than the market return of around 14% (not including dividends) in the same period. That's a solid performance by our standards! On the other hand, longer term shareholders have had a tougher run, with the stock falling 36% in three years.
Since it's been a strong week for Peab shareholders, let's have a look at trend of the longer term fundamentals.
Check out our latest analysis for Peab
While the efficient markets hypothesis continues to be taught by some, it has been proven that markets are over-reactive dynamic systems, and investors are not always rational. One way to examine how market sentiment has changed over time is to look at the interaction between a company's share price and its earnings per share (EPS).
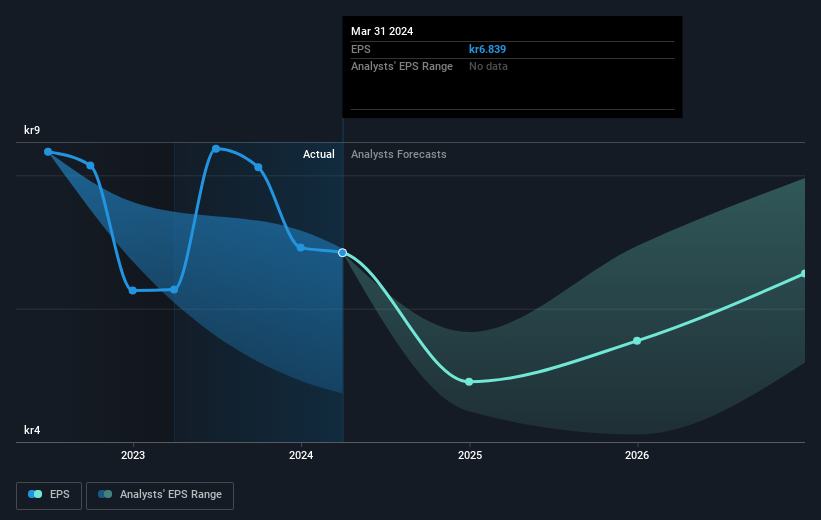
Peab was able to grow EPS by 8.8% in the last twelve months. This EPS growth is significantly lower than the 46% increase in the share price. This indicates that the market is now more optimistic about the stock.
The image below shows how EPS has tracked over time (if you click on the image you can see greater detail).
We consider it positive that insiders have made significant purchases in the last year. Even so, future earnings will be far more important to whether current shareholders make money. It might be well worthwhile taking a look at our free report on Peab's earnings, revenue and cash flow.
What About Dividends?
It is important to consider the total shareholder return, as well as the share price return, for any given stock. The TSR is a return calculation that accounts for the value of cash dividends (assuming that any dividend received was reinvested) and the calculated value of any discounted capital raisings and spin-offs. It's fair to say that the TSR gives a more complete picture for stocks that pay a dividend. We note that for Peab the TSR over the last 1 year was 49%, which is better than the share price return mentioned above. And there's no prize for guessing that the dividend payments largely explain the divergence!
A Different Perspective
It's good to see that Peab has rewarded shareholders with a total shareholder return of 49% in the last twelve months. That's including the dividend. That gain is better than the annual TSR over five years, which is 1.7%. Therefore it seems like sentiment around the company has been positive lately. Someone with an optimistic perspective could view the recent improvement in TSR as indicating that the business itself is getting better with time. It's always interesting to track share price performance over the longer term. But to understand Peab better, we need to consider many other factors. For example, we've discovered 3 warning signs for Peab (2 make us uncomfortable!) that you should be aware of before investing here.
If you like to buy stocks alongside management, then you might just love this free list of companies. (Hint: most of them are flying under the radar).
Please note, the market returns quoted in this article reflect the market weighted average returns of stocks that currently trade on Swedish exchanges.
New: Manage All Your Stock Portfolios in One Place
We've created the ultimate portfolio companion for stock investors, and it's free.
• Connect an unlimited number of Portfolios and see your total in one currency
• Be alerted to new Warning Signs or Risks via email or mobile
• Track the Fair Value of your stocks
Have feedback on this article? Concerned about the content? Get in touch with us directly. Alternatively, email editorial-team (at) simplywallst.com.
This article by Simply Wall St is general in nature. We provide commentary based on historical data and analyst forecasts only using an unbiased methodology and our articles are not intended to be financial advice. It does not constitute a recommendation to buy or sell any stock, and does not take account of your objectives, or your financial situation. We aim to bring you long-term focused analysis driven by fundamental data. Note that our analysis may not factor in the latest price-sensitive company announcements or qualitative material. Simply Wall St has no position in any stocks mentioned.
Have feedback on this article? Concerned about the content? Get in touch with us directly. Alternatively, email editorial-team@simplywallst.com
About OM:PEAB B
Peab
Operates as a construction and civil engineering company in Sweden, Norway, Finland, Denmark, and internationally.
Adequate balance sheet second-rate dividend payer.
