
Advertisement
The Market Lifts Precomp Solutions AB (publ) (STO:PCOM B) Shares 73% But It Can Do More
The Precomp Solutions AB (publ) (STO:PCOM B) share price has done very well over the last month, posting an excellent gain of 73%. Notwithstanding the latest gain, the annual share price return of 5.2% isn't as impressive.
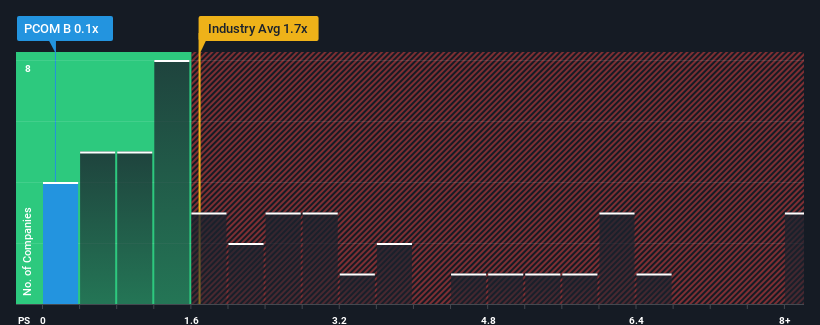
In spite of the firm bounce in price, Precomp Solutions' price-to-sales (or "P/S") ratio of 0.1x might still make it look like a buy right now compared to the Machinery industry in Sweden, where around half of the companies have P/S ratios above 1.7x and even P/S above 4x are quite common. Although, it's not wise to just take the P/S at face value as there may be an explanation why it's limited.
View our latest analysis for Precomp Solutions
What Does Precomp Solutions' P/S Mean For Shareholders?
For example, consider that Precomp Solutions' financial performance has been poor lately as its revenue has been in decline. One possibility is that the P/S is low because investors think the company won't do enough to avoid underperforming the broader industry in the near future. If you like the company, you'd be hoping this isn't the case so that you could potentially pick up some stock while it's out of favour.
Although there are no analyst estimates available for Precomp Solutions, take a look at this free data-rich visualisation to see how the company stacks up on earnings, revenue and cash flow.Do Revenue Forecasts Match The Low P/S Ratio?
In order to justify its P/S ratio, Precomp Solutions would need to produce sluggish growth that's trailing the industry.
In reviewing the last year of financials, we were disheartened to see the company's revenues fell to the tune of 1.7%. However, a few very strong years before that means that it was still able to grow revenue by an impressive 51% in total over the last three years. So we can start by confirming that the company has generally done a very good job of growing revenue over that time, even though it had some hiccups along the way.
Weighing the recent medium-term upward revenue trajectory against the broader industry's one-year forecast for contraction of 1.4% shows it's a great look while it lasts.
In light of this, it's quite peculiar that Precomp Solutions' P/S sits below the majority of other companies. Apparently some shareholders believe the recent performance has exceeded its limits and have been accepting significantly lower selling prices.
The Key Takeaway
Despite Precomp Solutions' share price climbing recently, its P/S still lags most other companies. Using the price-to-sales ratio alone to determine if you should sell your stock isn't sensible, however it can be a practical guide to the company's future prospects.
Looking at the figures, it's surprising to see Precomp Solutions currently trades on a much lower than expected P/S since its recent three-year revenue growth is beating forecasts for a struggling industry. One assumption would be that there are some underlying risks to revenue that are keeping the P/S from rising to match the its strong performance. Perhaps there is some hesitation about the company's ability to stay its recent course and swim against the current of the broader industry turmoil. At least the risk of a price drop looks to be subdued, but investors think future revenue could see a lot of volatility.
There are also other vital risk factors to consider before investing and we've discovered 4 warning signs for Precomp Solutions that you should be aware of.
If strong companies turning a profit tickle your fancy, then you'll want to check out this free list of interesting companies that trade on a low P/E (but have proven they can grow earnings).
New: Manage All Your Stock Portfolios in One Place
We've created the ultimate portfolio companion for stock investors, and it's free.
• Connect an unlimited number of Portfolios and see your total in one currency
• Be alerted to new Warning Signs or Risks via email or mobile
• Track the Fair Value of your stocks
Have feedback on this article? Concerned about the content? Get in touch with us directly. Alternatively, email editorial-team (at) simplywallst.com.
This article by Simply Wall St is general in nature. We provide commentary based on historical data and analyst forecasts only using an unbiased methodology and our articles are not intended to be financial advice. It does not constitute a recommendation to buy or sell any stock, and does not take account of your objectives, or your financial situation. We aim to bring you long-term focused analysis driven by fundamental data. Note that our analysis may not factor in the latest price-sensitive company announcements or qualitative material. Simply Wall St has no position in any stocks mentioned.
About OM:PCOM B
Precomp Solutions
Manufactures and supplies precision components and cutting tools in Europe.
Slight risk with questionable track record.
Market Insights

Advertisement
Community Narratives
The company that turned a verb into a global necessity and basically runs the modern internet, digital ads, smartphones, maps, and AI.
Fair Value US$300.00|6.3% undervalued
OS
Community Contributor
Flowers Foods Pays A Fair Price For Health
Fair Value US$16.12|26.0% undervalued
NV
Community Contributor
TMX Group will thrive with 33.3% profit margin and enduring market moat
Fair Value CA$49.90|3.7% overvalued
LI
Community Contributor