Advertisement
Howard Marks put it nicely when he said that, rather than worrying about share price volatility, 'The possibility of permanent loss is the risk I worry about... and every practical investor I know worries about.' When we think about how risky a company is, we always like to look at its use of debt, since debt overload can lead to ruin. We note that Precomp Solutions AB (publ) (STO:PCOM B) does have debt on its balance sheet. But the real question is whether this debt is making the company risky.
When Is Debt A Problem?
Debt is a tool to help businesses grow, but if a business is incapable of paying off its lenders, then it exists at their mercy. Ultimately, if the company can't fulfill its legal obligations to repay debt, shareholders could walk away with nothing. While that is not too common, we often do see indebted companies permanently diluting shareholders because lenders force them to raise capital at a distressed price. Of course, debt can be an important tool in businesses, particularly capital heavy businesses. When we think about a company's use of debt, we first look at cash and debt together.
What Is Precomp Solutions's Net Debt?
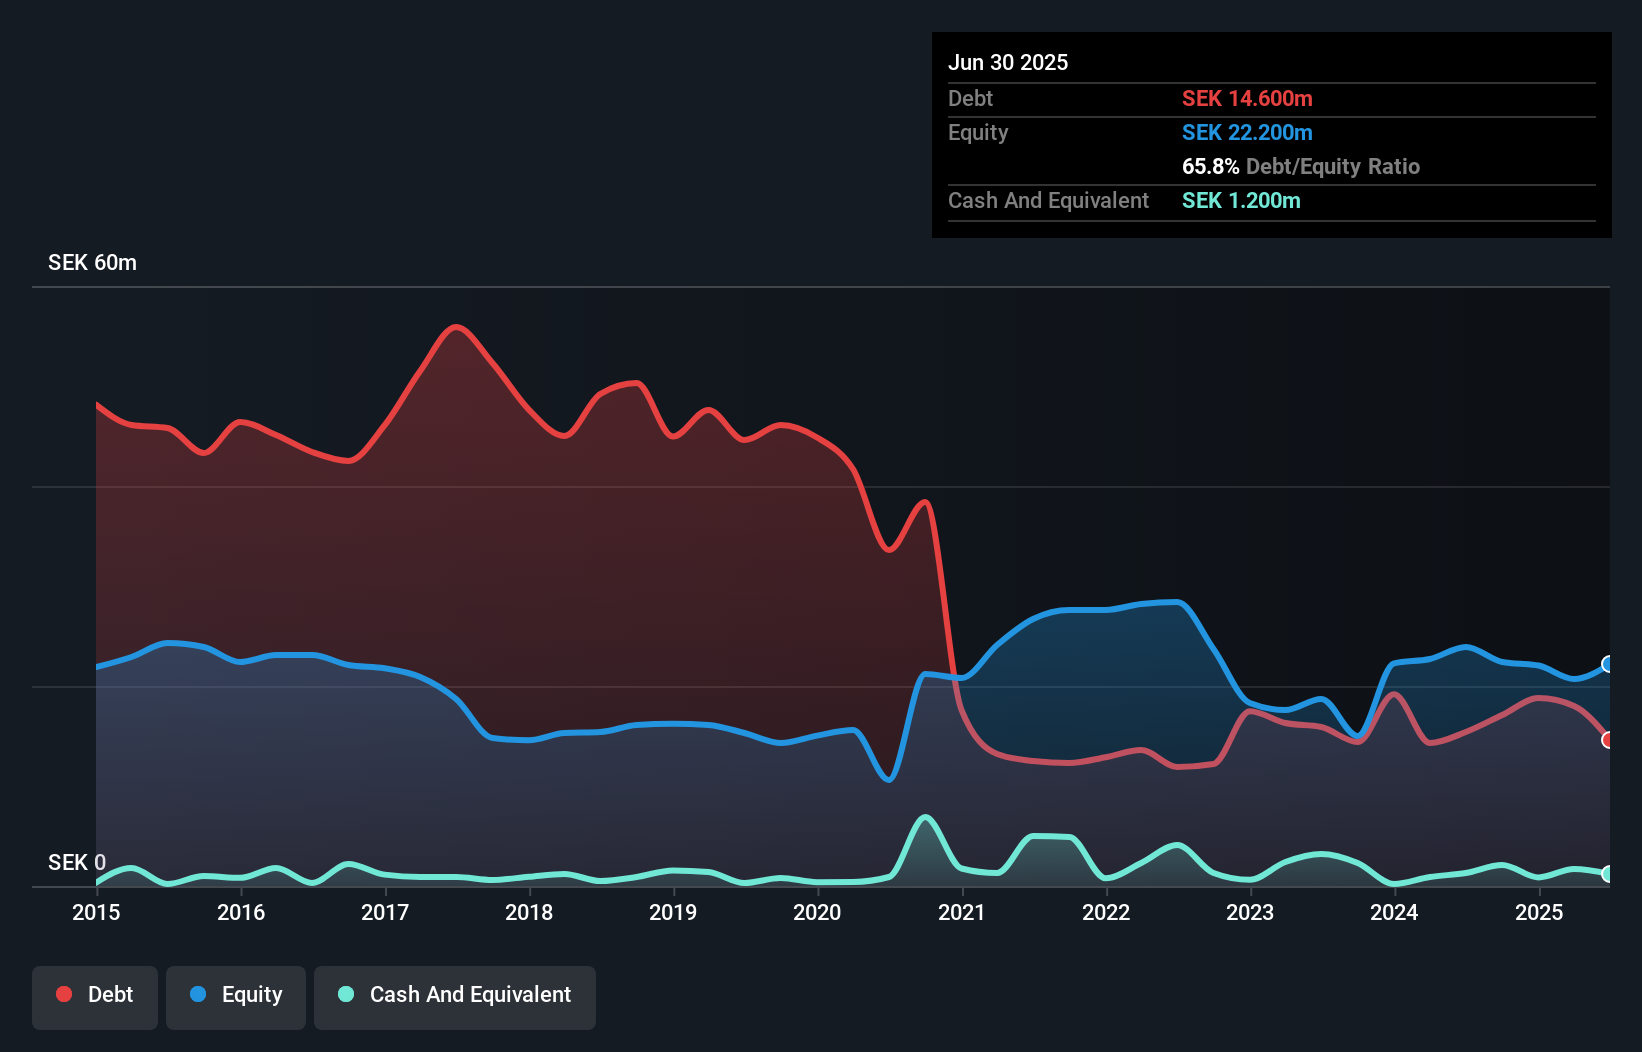
You can click the graphic below for the historical numbers, but it shows that Precomp Solutions had kr14.6m of debt in June 2025, down from kr17.1m, one year before. However, it also had kr1.20m in cash, and so its net debt is kr13.4m.
A Look At Precomp Solutions' Liabilities
Zooming in on the latest balance sheet data, we can see that Precomp Solutions had liabilities of kr39.8m due within 12 months and liabilities of kr14.4m due beyond that. Offsetting this, it had kr1.20m in cash and kr4.90m in receivables that were due within 12 months. So its liabilities total kr48.1m more than the combination of its cash and short-term receivables.
The deficiency here weighs heavily on the kr27.8m company itself, as if a child were struggling under the weight of an enormous back-pack full of books, his sports gear, and a trumpet. So we'd watch its balance sheet closely, without a doubt. At the end of the day, Precomp Solutions would probably need a major re-capitalization if its creditors were to demand repayment.
See our latest analysis for Precomp Solutions
We use two main ratios to inform us about debt levels relative to earnings. The first is net debt divided by earnings before interest, tax, depreciation, and amortization (EBITDA), while the second is how many times its earnings before interest and tax (EBIT) covers its interest expense (or its interest cover, for short). The advantage of this approach is that we take into account both the absolute quantum of debt (with net debt to EBITDA) and the actual interest expenses associated with that debt (with its interest cover ratio).
Even though Precomp Solutions's debt is only 1.6, its interest cover is really very low at 1.4. This does have us wondering if the company pays high interest because it is considered risky. Either way there's no doubt the stock is using meaningful leverage. It is well worth noting that Precomp Solutions's EBIT shot up like bamboo after rain, gaining 84% in the last twelve months. That'll make it easier to manage its debt. There's no doubt that we learn most about debt from the balance sheet. But you can't view debt in total isolation; since Precomp Solutions will need earnings to service that debt. So when considering debt, it's definitely worth looking at the earnings trend. Click here for an interactive snapshot.
Finally, while the tax-man may adore accounting profits, lenders only accept cold hard cash. So the logical step is to look at the proportion of that EBIT that is matched by actual free cash flow. Over the last two years, Precomp Solutions saw substantial negative free cash flow, in total. While investors are no doubt expecting a reversal of that situation in due course, it clearly does mean its use of debt is more risky.
Our View
To be frank both Precomp Solutions's conversion of EBIT to free cash flow and its track record of staying on top of its total liabilities make us rather uncomfortable with its debt levels. But on the bright side, its EBIT growth rate is a good sign, and makes us more optimistic. We're quite clear that we consider Precomp Solutions to be really rather risky, as a result of its balance sheet health. So we're almost as wary of this stock as a hungry kitten is about falling into its owner's fish pond: once bitten, twice shy, as they say. The balance sheet is clearly the area to focus on when you are analysing debt. But ultimately, every company can contain risks that exist outside of the balance sheet. For example, we've discovered 3 warning signs for Precomp Solutions that you should be aware of before investing here.
At the end of the day, it's often better to focus on companies that are free from net debt. You can access our special list of such companies (all with a track record of profit growth). It's free.
New: Manage All Your Stock Portfolios in One Place
We've created the ultimate portfolio companion for stock investors, and it's free.
• Connect an unlimited number of Portfolios and see your total in one currency
• Be alerted to new Warning Signs or Risks via email or mobile
• Track the Fair Value of your stocks
Have feedback on this article? Concerned about the content? Get in touch with us directly. Alternatively, email editorial-team (at) simplywallst.com.
This article by Simply Wall St is general in nature. We provide commentary based on historical data and analyst forecasts only using an unbiased methodology and our articles are not intended to be financial advice. It does not constitute a recommendation to buy or sell any stock, and does not take account of your objectives, or your financial situation. We aim to bring you long-term focused analysis driven by fundamental data. Note that our analysis may not factor in the latest price-sensitive company announcements or qualitative material. Simply Wall St has no position in any stocks mentioned.
About OM:PCOM B
Precomp Solutions
Manufactures precision components for the automotive and engineering industries in Europe.
Slight risk and slightly overvalued.
Market Insights


Advertisement
Weekly Picks
LO


Lou_Basenese on Optimi Health ·
The Only Psychedelic Company Already Selling MDMA and Psilocybin to Real Patients, Yet Priced Like It Doesn’t Exist
Fair Value:US$1155.3% undervalued
50 followersusers have followed this narrative
2 commentsusers have commented on this narrative
9 likesusers have liked this narrative
WE


WealthAP on Novo Nordisk ·
Novo Nordisk (NVO): Is the "Easy Growth" Story Over?
Fair Value:DKK 407.7719.9% undervalued
69 followersusers have followed this narrative
0 commentsusers have commented on this narrative
8 likesusers have liked this narrative
VA


ValueInvestingSubstack on Zoetis ·
Zoetis down -50% over the past year
Fair Value:US$92.9217.2% undervalued
24 followersusers have followed this narrative
0 commentsusers have commented on this narrative
9 likesusers have liked this narrative
CE


CentryResearch on Centrus Energy ·
Centrus Energy: The Next Nuclear Bottleneck Isn't Reactors. It's Fuel.
Fair Value:US$1907.4% undervalued
24 followersusers have followed this narrative
0 commentsusers have commented on this narrative
11 likesusers have liked this narrative
Recently Updated Narratives
CL


Clive_Thompson on Green Tea Group ·
One of China's Fastest-Growing Restaurant Chains Trades on Just 7x Earnings and an 8% Dividend
Fair Value:HK$8.728.0% undervalued
1 followerusers have followed this narrative
0 commentsusers have commented on this narrative
0 likesusers have liked this narrative
AZ

aziz_22khi on PRG Holdings Berhad ·
WHERE DID THE SIX MILLION SHARES GO? THE PRG OWNERSHIP TRAIL INVESTORS CANNOT IGNORE
Fair Value:RM 0.4477.3% undervalued
1 followerusers have followed this narrative
0 commentsusers have commented on this narrative
0 likesusers have liked this narrative
BR


Brunhilde_Wagner on Copart ·
Compounder to Cash Generator in Real Time
Fair Value:US$2710.3% overvalued
1 followerusers have followed this narrative
0 commentsusers have commented on this narrative
0 likesusers have liked this narrative
Popular Narratives
CU

CubanEros on Microsoft ·
A wonderful business at reasonable price.
Fair Value:US$419.917.3% undervalued
86 followersusers have followed this narrative
0 commentsusers have commented on this narrative
6 likesusers have liked this narrative
OS


oscargarcia on NVIDIA ·
The company that went from selling GPUs to gamers to becoming the AI arms dealer of the 21st century.
Fair Value:US$28029.8% undervalued
195 followersusers have followed this narrative
9 commentsusers have commented on this narrative
15 likesusers have liked this narrative
BE

benjamin_lvieq on PayPal Holdings ·
PayPal: PayPal Doesn't Need to Grow – It Needs to Stop Falling – A Mispriced Cash Machine With a Cannibal Buyback
Fair Value:US$6513.7% undervalued
72 followersusers have followed this narrative
2 commentsusers have commented on this narrative
11 likesusers have liked this narrative
Trending Discussion
DE

derek_3wsdg on Teladoc Health ·
You’ve overlooked the activist investor factor. Travis Cocke’s Voss has announced 5% ownership through a 13G filing. They’ve added to that 5% since, and in doing so, have created a structural trap door for 27.42 Million Shares actively sold short. Chuck will announce lots of positives on July 29 but it’s what Voss announces shortly after that will rock the overextended Teledoc shorts. The Walmart partnership is the tip of the iceberg. The market is missing the sheer regulatory and enterprise friction of modern corporate healthcare. Teladoc isn't a "consumer app"; it is the primary digital infrastructure integrated directly into the legacy backends of Tier-1 insurance companies and fortune 500 employers, covering 105 million+ lives. Teladoc is acting as the digital top-of-funnel engine for the world's largest retailer. If Voss pushes the narrative that Teladoc is effectively the outsourced digital brain of Walmart's entire healthcare footprint, the fair value shifts from a basic health multiple to an enterprise distribution premium. Additionally , we are in a structural gold rush for high-quality, legally compliant, longitudinal medical data to train vertical healthcare AI models. Large technology hyperscalers and pharmaceutical giants cannot simply scrape the internet for this; they need structured clinical inputs. Teladoc sits on one of the largest de-identified virtual medical datasets on earth. From the activist playbook , we’ll see Voss demand the immediate creation of a Data & Diagnostics Licensing Division, transforming a legacy liability into an incredibly high-margin, pure-software data asset that requires zero human clinician hours to scale. Chuck is doing great work and deserves credi5 for the Teledoc turnaround but it will be Travis Cocke who will be responsible for a share price way beyond your $15 valuation.
1
|0

