- Sweden
- /
- Aerospace & Defense
- /
- OM:IVSO
Invisio's (STO:IVSO) earnings growth rate lags the 25% CAGR delivered to shareholders


When you buy a stock there is always a possibility that it could drop 100%. But on a lighter note, a good company can see its share price rise well over 100%. For instance, the price of Invisio AB (publ) (STO:IVSO) stock is up an impressive 204% over the last five years. In the last week shares have slid back 5.6%.
While this past week has detracted from the company's five-year return, let's look at the recent trends of the underlying business and see if the gains have been in alignment.
See our latest analysis for Invisio
To quote Buffett, 'Ships will sail around the world but the Flat Earth Society will flourish. There will continue to be wide discrepancies between price and value in the marketplace...' By comparing earnings per share (EPS) and share price changes over time, we can get a feel for how investor attitudes to a company have morphed over time.
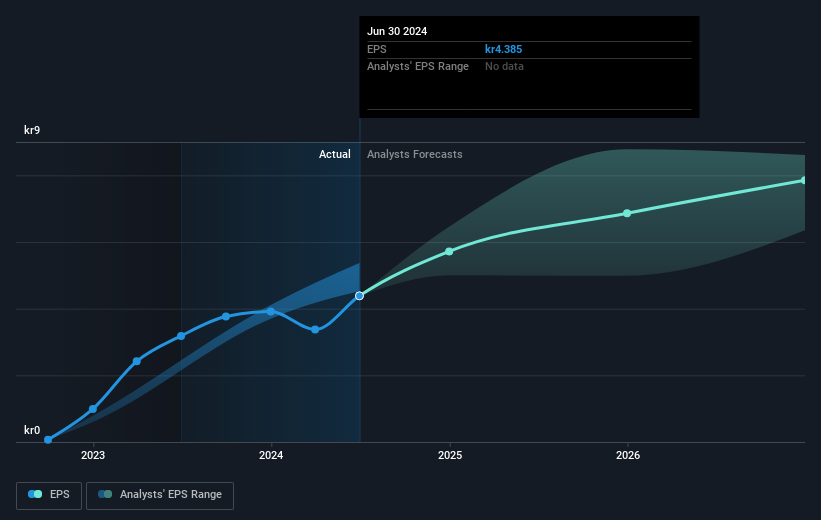
Over half a decade, Invisio managed to grow its earnings per share at 29% a year. So the EPS growth rate is rather close to the annualized share price gain of 25% per year. Therefore one could conclude that sentiment towards the shares hasn't morphed very much. Indeed, it would appear the share price is reacting to the EPS.
You can see how EPS has changed over time in the image below (click on the chart to see the exact values).
We like that insiders have been buying shares in the last twelve months. Even so, future earnings will be far more important to whether current shareholders make money. It might be well worthwhile taking a look at our free report on Invisio's earnings, revenue and cash flow.
What About Dividends?
When looking at investment returns, it is important to consider the difference between total shareholder return (TSR) and share price return. The TSR incorporates the value of any spin-offs or discounted capital raisings, along with any dividends, based on the assumption that the dividends are reinvested. It's fair to say that the TSR gives a more complete picture for stocks that pay a dividend. In the case of Invisio, it has a TSR of 211% for the last 5 years. That exceeds its share price return that we previously mentioned. And there's no prize for guessing that the dividend payments largely explain the divergence!
A Different Perspective
Invisio shareholders gained a total return of 10% during the year. Unfortunately this falls short of the market return. On the bright side, the longer term returns (running at about 25% a year, over half a decade) look better. It's quite possible the business continues to execute with prowess, even as the share price gains are slowing. It's always interesting to track share price performance over the longer term. But to understand Invisio better, we need to consider many other factors. To that end, you should learn about the 2 warning signs we've spotted with Invisio (including 1 which can't be ignored) .
Invisio is not the only stock insiders are buying. So take a peek at this free list of small cap companies at attractive valuations which insiders have been buying.
Please note, the market returns quoted in this article reflect the market weighted average returns of stocks that currently trade on Swedish exchanges.
New: AI Stock Screener & Alerts
Our new AI Stock Screener scans the market every day to uncover opportunities.
• Dividend Powerhouses (3%+ Yield)
• Undervalued Small Caps with Insider Buying
• High growth Tech and AI Companies
Or build your own from over 50 metrics.
Have feedback on this article? Concerned about the content? Get in touch with us directly. Alternatively, email editorial-team (at) simplywallst.com.
This article by Simply Wall St is general in nature. We provide commentary based on historical data and analyst forecasts only using an unbiased methodology and our articles are not intended to be financial advice. It does not constitute a recommendation to buy or sell any stock, and does not take account of your objectives, or your financial situation. We aim to bring you long-term focused analysis driven by fundamental data. Note that our analysis may not factor in the latest price-sensitive company announcements or qualitative material. Simply Wall St has no position in any stocks mentioned.
About OM:IVSO
Invisio
Develops and sells communication and hearing protection systems for professionals in the defense, law enforcement, and security sectors in Sweden, Europe, North America, and internationally.
Flawless balance sheet with high growth potential.
