
Advertisement
Update: KABE Group AB (publ.) (STO:KABE B) Stock Gained 42% In The Last Five Years
If you buy and hold a stock for many years, you'd hope to be making a profit. But more than that, you probably want to see it rise more than the market average. But KABE Group AB (publ.) (STO:KABE B) has fallen short of that second goal, with a share price rise of 42% over five years, which is below the market return. Zooming in, the stock is up just 4.5% in the last year.
Check out our latest analysis for KABE Group AB (publ.)
In his essay The Superinvestors of Graham-and-Doddsville Warren Buffett described how share prices do not always rationally reflect the value of a business. One way to examine how market sentiment has changed over time is to look at the interaction between a company's share price and its earnings per share (EPS).
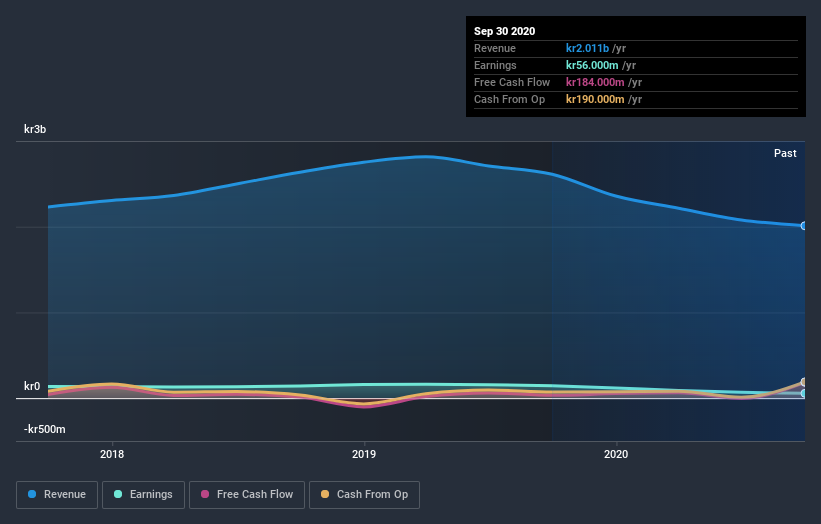
During five years of share price growth, KABE Group AB (publ.) actually saw its EPS drop 5.2% per year.
This means it's unlikely the market is judging the company based on earnings growth. Because earnings per share don't seem to match up with the share price, we'll take a look at other metrics instead.
In contrast revenue growth of 6.4% per year is probably viewed as evidence that KABE Group AB (publ.) is growing, a real positive. It's quite possible that management are prioritizing revenue growth over EPS growth at the moment.
You can see below how earnings and revenue have changed over time (discover the exact values by clicking on the image).
If you are thinking of buying or selling KABE Group AB (publ.) stock, you should check out this FREE detailed report on its balance sheet.
What about the Total Shareholder Return (TSR)?
We'd be remiss not to mention the difference between KABE Group AB (publ.)'s total shareholder return (TSR) and its share price return. Arguably the TSR is a more complete return calculation because it accounts for the value of dividends (as if they were reinvested), along with the hypothetical value of any discounted capital that have been offered to shareholders. Dividends have been really beneficial for KABE Group AB (publ.) shareholders, and that cash payout contributed to why its TSR of 59%, over the last 5 years, is better than the share price return.
A Different Perspective
KABE Group AB (publ.) provided a TSR of 4.5% over the last twelve months. Unfortunately this falls short of the market return. If we look back over five years, the returns are even better, coming in at 10% per year for five years. It may well be that this is a business worth popping on the watching, given the continuing positive reception, over time, from the market. It's always interesting to track share price performance over the longer term. But to understand KABE Group AB (publ.) better, we need to consider many other factors. Take risks, for example - KABE Group AB (publ.) has 2 warning signs (and 1 which shouldn't be ignored) we think you should know about.
Of course, you might find a fantastic investment by looking elsewhere. So take a peek at this free list of companies we expect will grow earnings.
Please note, the market returns quoted in this article reflect the market weighted average returns of stocks that currently trade on SE exchanges.
When trading KABE Group AB (publ.) or any other investment, use the platform considered by many to be the Professional's Gateway to the Worlds Market, Interactive Brokers. You get the lowest-cost* trading on stocks, options, futures, forex, bonds and funds worldwide from a single integrated account. Promoted
Valuation is complex, but we're here to simplify it.
Discover if KABE Group AB (publ.) might be undervalued or overvalued with our detailed analysis, featuring fair value estimates, potential risks, dividends, insider trades, and its financial condition.
Access Free AnalysisThis article by Simply Wall St is general in nature. It does not constitute a recommendation to buy or sell any stock, and does not take account of your objectives, or your financial situation. We aim to bring you long-term focused analysis driven by fundamental data. Note that our analysis may not factor in the latest price-sensitive company announcements or qualitative material. Simply Wall St has no position in any stocks mentioned.
*Interactive Brokers Rated Lowest Cost Broker by StockBrokers.com Annual Online Review 2020
Have feedback on this article? Concerned about the content? Get in touch with us directly. Alternatively, email editorial-team (at) simplywallst.com.
About OM:KABE B
KABE Group AB (publ.)
Engages in the construction and sale of caravans, motorhomes, and camping accessories in Sweden, the United Kingdom, Germany, Norway, Finland, Denmark, Poland, and internationally.
Excellent balance sheet average dividend payer.
Similar Companies
Market Insights

Advertisement
Community Narratives
MicroVision will explode future revenue by 380.37% with a vision towards success
Fair Value US$60.00|98.4% undervalued
TH
Community Contributor
The Indispensable Artery for a New North American Economy
Fair Value CA$132.87|1.3% undervalued
TI
Community Contributor