
Advertisement
- Saudi Arabia
- /
- IT
- /
- SASE:7204
Could The Market Be Wrong About Perfect Presentation for Commercial Services Company (TADAWUL:7204) Given Its Attractive Financial Prospects?

Perfect Presentation for Commercial Services (TADAWUL:7204) has had a rough three months with its share price down 23%. However, stock prices are usually driven by a company’s financial performance over the long term, which in this case looks quite promising. Specifically, we decided to study Perfect Presentation for Commercial Services' ROE in this article.
Return on Equity or ROE is a test of how effectively a company is growing its value and managing investors’ money. Simply put, it is used to assess the profitability of a company in relation to its equity capital.
How Do You Calculate Return On Equity?
The formula for return on equity is:
Return on Equity = Net Profit (from continuing operations) ÷ Shareholders' Equity
So, based on the above formula, the ROE for Perfect Presentation for Commercial Services is:
29% = ر.س166m ÷ ر.س578m (Based on the trailing twelve months to March 2025).
The 'return' is the yearly profit. One way to conceptualize this is that for each SAR1 of shareholders' capital it has, the company made SAR0.29 in profit.
View our latest analysis for Perfect Presentation for Commercial Services
What Has ROE Got To Do With Earnings Growth?
So far, we've learned that ROE is a measure of a company's profitability. Depending on how much of these profits the company reinvests or "retains", and how effectively it does so, we are then able to assess a company’s earnings growth potential. Generally speaking, other things being equal, firms with a high return on equity and profit retention, have a higher growth rate than firms that don’t share these attributes.
Perfect Presentation for Commercial Services' Earnings Growth And 29% ROE
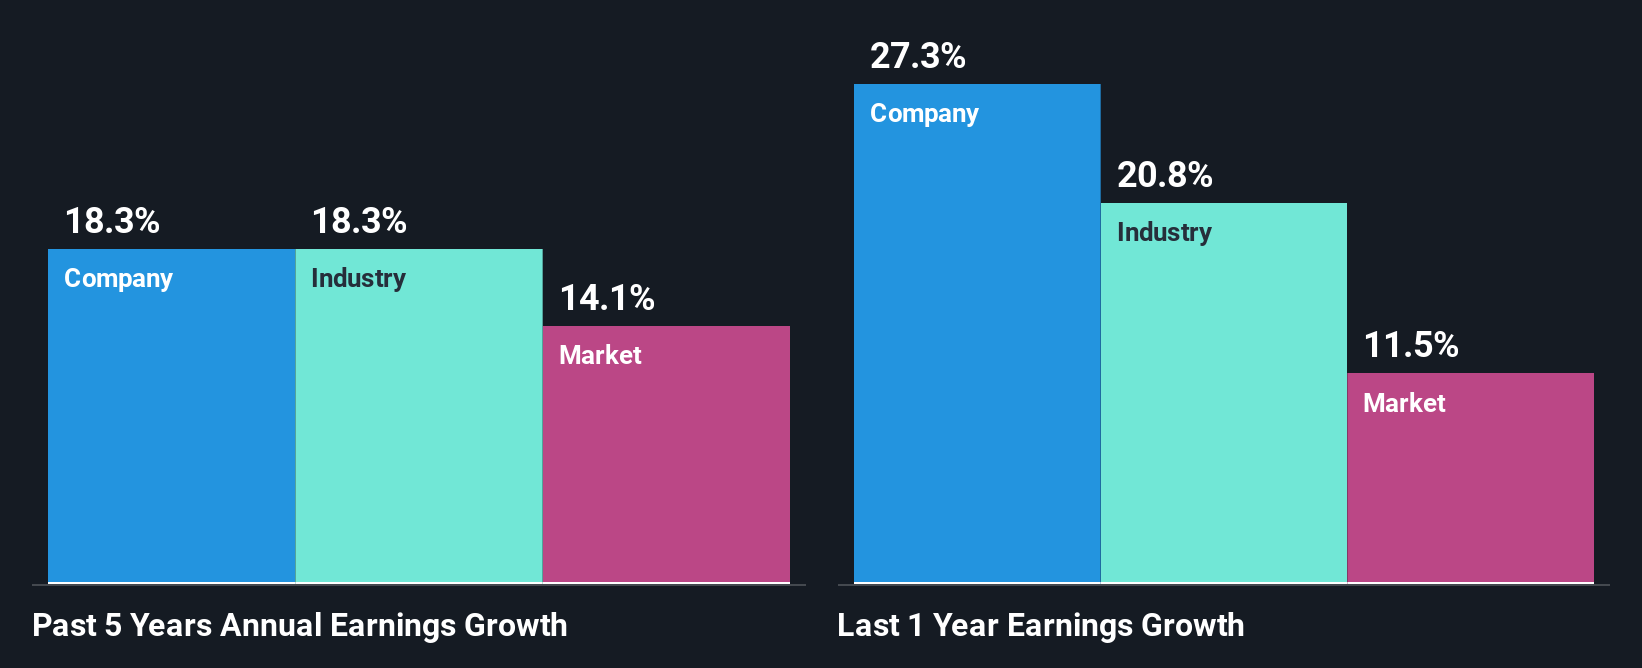
To begin with, Perfect Presentation for Commercial Services seems to have a respectable ROE. And on comparing with the industry, we found that the the average industry ROE is similar at 29%. Consequently, this likely laid the ground for the decent growth of 18% seen over the past five years by Perfect Presentation for Commercial Services.
As a next step, we compared Perfect Presentation for Commercial Services' net income growth with the industry and found that the company has a similar growth figure when compared with the industry average growth rate of 18% in the same period.
The basis for attaching value to a company is, to a great extent, tied to its earnings growth. The investor should try to establish if the expected growth or decline in earnings, whichever the case may be, is priced in. Doing so will help them establish if the stock's future looks promising or ominous. One good indicator of expected earnings growth is the P/E ratio which determines the price the market is willing to pay for a stock based on its earnings prospects. So, you may want to check if Perfect Presentation for Commercial Services is trading on a high P/E or a low P/E, relative to its industry.
Is Perfect Presentation for Commercial Services Using Its Retained Earnings Effectively?
While the company did pay out a portion of its dividend in the past, it currently doesn't pay a regular dividend. We infer that the company has been reinvesting all of its profits to grow its business.
Summary
Overall, we are quite pleased with Perfect Presentation for Commercial Services' performance. Particularly, we like that the company is reinvesting heavily into its business, and at a high rate of return. Unsurprisingly, this has led to an impressive earnings growth. With that said, the latest industry analyst forecasts reveal that the company's earnings growth is expected to slow down. Are these analysts expectations based on the broad expectations for the industry, or on the company's fundamentals? Click here to be taken to our analyst's forecasts page for the company.
New: Manage All Your Stock Portfolios in One Place
We've created the ultimate portfolio companion for stock investors, and it's free.
• Connect an unlimited number of Portfolios and see your total in one currency
• Be alerted to new Warning Signs or Risks via email or mobile
• Track the Fair Value of your stocks
Have feedback on this article? Concerned about the content? Get in touch with us directly. Alternatively, email editorial-team (at) simplywallst.com.
This article by Simply Wall St is general in nature. We provide commentary based on historical data and analyst forecasts only using an unbiased methodology and our articles are not intended to be financial advice. It does not constitute a recommendation to buy or sell any stock, and does not take account of your objectives, or your financial situation. We aim to bring you long-term focused analysis driven by fundamental data. Note that our analysis may not factor in the latest price-sensitive company announcements or qualitative material. Simply Wall St has no position in any stocks mentioned.
About SASE:7204
Perfect Presentation for Commercial Services
Operates as an ICT services and technology solutions company in the Kingdom of Saudi Arabia.
Solid track record with adequate balance sheet.
Market Insights

Advertisement
Community Narratives
Vita Life Sciences Set for a 12.72% Revenue Growth While Tackling Operational Challenges
Fair Value AU$2.42|12.0% undervalued
RO
Community Contributor
Vossloh rides a €500 billion wave to boost growth and earnings in the next decade
Fair Value €78.41|5.2% undervalued
CH
Community Contributor
Intuitive Surgical Will Transform Healthcare with 12% Revenue Growth
Fair Value US$325.55|57.3% overvalued
UN
Community Contributor