
Advertisement
- Saudi Arabia
- /
- Chemicals
- /
- SASE:9552
Here's What's Concerning About Saudi Top for Trading's (TADAWUL:9552) Returns On Capital
What financial metrics can indicate to us that a company is maturing or even in decline? A business that's potentially in decline often shows two trends, a return on capital employed (ROCE) that's declining, and a base of capital employed that's also declining. Trends like this ultimately mean the business is reducing its investments and also earning less on what it has invested. Having said that, after a brief look, Saudi Top for Trading (TADAWUL:9552) we aren't filled with optimism, but let's investigate further.
Return On Capital Employed (ROCE): What Is It?
For those who don't know, ROCE is a measure of a company's yearly pre-tax profit (its return), relative to the capital employed in the business. To calculate this metric for Saudi Top for Trading, this is the formula:
Return on Capital Employed = Earnings Before Interest and Tax (EBIT) ÷ (Total Assets - Current Liabilities)
0.076 = ر.س6.0m ÷ (ر.س133m - ر.س55m) (Based on the trailing twelve months to December 2023).
Therefore, Saudi Top for Trading has an ROCE of 7.6%. On its own, that's a low figure but it's around the 6.7% average generated by the Chemicals industry.
Check out our latest analysis for Saudi Top for Trading
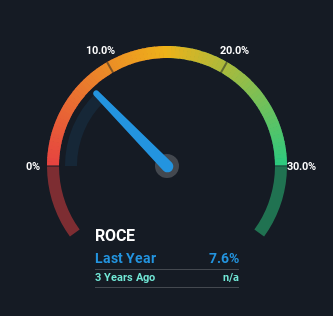
Historical performance is a great place to start when researching a stock so above you can see the gauge for Saudi Top for Trading's ROCE against it's prior returns. If you're interested in investigating Saudi Top for Trading's past further, check out this free graph covering Saudi Top for Trading's past earnings, revenue and cash flow.
How Are Returns Trending?
There is reason to be cautious about Saudi Top for Trading, given the returns are trending downwards. About one year ago, returns on capital were 37%, however they're now substantially lower than that as we saw above. On top of that, it's worth noting that the amount of capital employed within the business has remained relatively steady. Companies that exhibit these attributes tend to not be shrinking, but they can be mature and facing pressure on their margins from competition. If these trends continue, we wouldn't expect Saudi Top for Trading to turn into a multi-bagger.
On a side note, Saudi Top for Trading's current liabilities have increased over the last one year to 41% of total assets, effectively distorting the ROCE to some degree. If current liabilities hadn't increased as much as they did, the ROCE could actually be even lower. And with current liabilities at these levels, suppliers or short-term creditors are effectively funding a large part of the business, which can introduce some risks.
Our Take On Saudi Top for Trading's ROCE
All in all, the lower returns from the same amount of capital employed aren't exactly signs of a compounding machine. Long term shareholders who've owned the stock over the last year have experienced a 28% depreciation in their investment, so it appears the market might not like these trends either. Unless there is a shift to a more positive trajectory in these metrics, we would look elsewhere.
Since virtually every company faces some risks, it's worth knowing what they are, and we've spotted 5 warning signs for Saudi Top for Trading (of which 1 is a bit concerning!) that you should know about.
While Saudi Top for Trading may not currently earn the highest returns, we've compiled a list of companies that currently earn more than 25% return on equity. Check out this free list here.
New: Manage All Your Stock Portfolios in One Place
We've created the ultimate portfolio companion for stock investors, and it's free.
• Connect an unlimited number of Portfolios and see your total in one currency
• Be alerted to new Warning Signs or Risks via email or mobile
• Track the Fair Value of your stocks
Have feedback on this article? Concerned about the content? Get in touch with us directly. Alternatively, email editorial-team (at) simplywallst.com.
This article by Simply Wall St is general in nature. We provide commentary based on historical data and analyst forecasts only using an unbiased methodology and our articles are not intended to be financial advice. It does not constitute a recommendation to buy or sell any stock, and does not take account of your objectives, or your financial situation. We aim to bring you long-term focused analysis driven by fundamental data. Note that our analysis may not factor in the latest price-sensitive company announcements or qualitative material. Simply Wall St has no position in any stocks mentioned.
Have feedback on this article? Concerned about the content? Get in touch with us directly. Alternatively, email editorial-team@simplywallst.com
About SASE:9552
Saudi Top for Trading
Engages in the manufacture and trade of plastic materials in the Kingdom of Saudi Arabia, Asia, the Middle East, Africa, and Europe.
Excellent balance sheet with acceptable track record.
Market Insights

Advertisement
Community Narratives
The company that turned a verb into a global necessity and basically runs the modern internet, digital ads, smartphones, maps, and AI.
Fair Value US$300.00|5.4% undervalued
OS
Community Contributor
Flowers Foods Pays A Fair Price For Health
Fair Value US$16.12|26.3% undervalued
NV
Community Contributor
TMX Group will thrive with 33.3% profit margin and enduring market moat
Fair Value CA$49.90|4.1% overvalued
LI
Community Contributor
The "Molecular Pencil": Why Beam's Technology is Built to Win
Fair Value US$65.01|62.7% undervalued
DA
Community Contributor