Stock Analysis
- Saudi Arabia
- /
- Hospitality
- /
- SASE:1830
Leejam Sports (TADAWUL:1830) sheds 4.4% this week, as yearly returns fall more in line with earnings growth

The most you can lose on any stock (assuming you don't use leverage) is 100% of your money. But on the bright side, you can make far more than 100% on a really good stock. One great example is Leejam Sports Company (TADAWUL:1830) which saw its share price drive 227% higher over five years. On top of that, the share price is up 23% in about a quarter.
While the stock has fallen 4.4% this week, it's worth focusing on the longer term and seeing if the stocks historical returns have been driven by the underlying fundamentals.
Check out our latest analysis for Leejam Sports
While the efficient markets hypothesis continues to be taught by some, it has been proven that markets are over-reactive dynamic systems, and investors are not always rational. One flawed but reasonable way to assess how sentiment around a company has changed is to compare the earnings per share (EPS) with the share price.
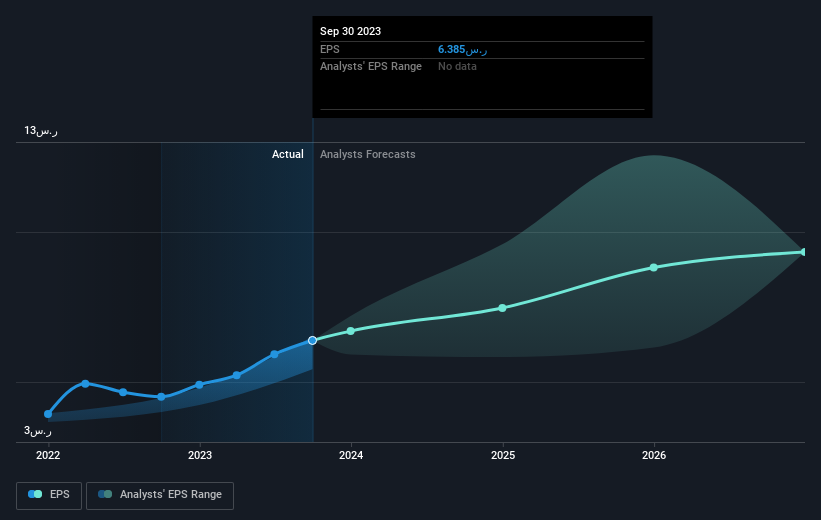
Over half a decade, Leejam Sports managed to grow its earnings per share at 14% a year. This EPS growth is slower than the share price growth of 27% per year, over the same period. So it's fair to assume the market has a higher opinion of the business than it did five years ago. That's not necessarily surprising considering the five-year track record of earnings growth.
You can see how EPS has changed over time in the image below (click on the chart to see the exact values).
It is of course excellent to see how Leejam Sports has grown profits over the years, but the future is more important for shareholders. If you are thinking of buying or selling Leejam Sports stock, you should check out this FREE detailed report on its balance sheet.
What About Dividends?
When looking at investment returns, it is important to consider the difference between total shareholder return (TSR) and share price return. The TSR incorporates the value of any spin-offs or discounted capital raisings, along with any dividends, based on the assumption that the dividends are reinvested. Arguably, the TSR gives a more comprehensive picture of the return generated by a stock. As it happens, Leejam Sports' TSR for the last 5 years was 258%, which exceeds the share price return mentioned earlier. This is largely a result of its dividend payments!
A Different Perspective
It's good to see that Leejam Sports has rewarded shareholders with a total shareholder return of 137% in the last twelve months. That's including the dividend. Since the one-year TSR is better than the five-year TSR (the latter coming in at 29% per year), it would seem that the stock's performance has improved in recent times. Given the share price momentum remains strong, it might be worth taking a closer look at the stock, lest you miss an opportunity. Before deciding if you like the current share price, check how Leejam Sports scores on these 3 valuation metrics.
But note: Leejam Sports may not be the best stock to buy. So take a peek at this free list of interesting companies with past earnings growth (and further growth forecast).
Please note, the market returns quoted in this article reflect the market weighted average returns of stocks that currently trade on Saudi exchanges.
Valuation is complex, but we're helping make it simple.
Find out whether Leejam Sports is potentially over or undervalued by checking out our comprehensive analysis, which includes fair value estimates, risks and warnings, dividends, insider transactions and financial health.
View the Free AnalysisHave feedback on this article? Concerned about the content? Get in touch with us directly. Alternatively, email editorial-team (at) simplywallst.com.
This article by Simply Wall St is general in nature. We provide commentary based on historical data and analyst forecasts only using an unbiased methodology and our articles are not intended to be financial advice. It does not constitute a recommendation to buy or sell any stock, and does not take account of your objectives, or your financial situation. We aim to bring you long-term focused analysis driven by fundamental data. Note that our analysis may not factor in the latest price-sensitive company announcements or qualitative material. Simply Wall St has no position in any stocks mentioned.
About SASE:1830
Leejam Sports
Leejam Sports Company operates sports and fitness centers in the Kingdom of Saudi Arabia and the United Arab Emirates.
Outstanding track record with adequate balance sheet.

