Stock Analysis
- Saudi Arabia
- /
- Hospitality
- /
- SASE:1830
Leejam Sports Company's (TADAWUL:1830) Stock Is Going Strong: Is the Market Following Fundamentals?

Leejam Sports (TADAWUL:1830) has had a great run on the share market with its stock up by a significant 27% over the last three months. Given the company's impressive performance, we decided to study its financial indicators more closely as a company's financial health over the long-term usually dictates market outcomes. In this article, we decided to focus on Leejam Sports' ROE.
ROE or return on equity is a useful tool to assess how effectively a company can generate returns on the investment it received from its shareholders. Put another way, it reveals the company's success at turning shareholder investments into profits.
Check out our latest analysis for Leejam Sports
How Is ROE Calculated?
Return on equity can be calculated by using the formula:
Return on Equity = Net Profit (from continuing operations) ÷ Shareholders' Equity
So, based on the above formula, the ROE for Leejam Sports is:
32% = ر.س334m ÷ ر.س1.0b (Based on the trailing twelve months to September 2023).
The 'return' is the profit over the last twelve months. So, this means that for every SAR1 of its shareholder's investments, the company generates a profit of SAR0.32.
What Has ROE Got To Do With Earnings Growth?
Thus far, we have learned that ROE measures how efficiently a company is generating its profits. Based on how much of its profits the company chooses to reinvest or "retain", we are then able to evaluate a company's future ability to generate profits. Assuming all else is equal, companies that have both a higher return on equity and higher profit retention are usually the ones that have a higher growth rate when compared to companies that don't have the same features.
A Side By Side comparison of Leejam Sports' Earnings Growth And 32% ROE
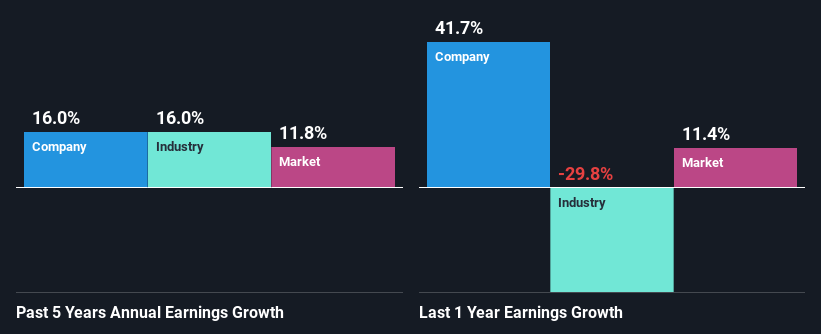
At first glance, Leejam Sports seems to have a decent ROE. Further, the company's ROE compares quite favorably to the industry average of 17%. Probably as a result of this, Leejam Sports was able to see a decent growth of 16% over the last five years.
We then performed a comparison between Leejam Sports' net income growth with the industry, which revealed that the company's growth is similar to the average industry growth of 16% in the same 5-year period.
Earnings growth is a huge factor in stock valuation. It’s important for an investor to know whether the market has priced in the company's expected earnings growth (or decline). By doing so, they will have an idea if the stock is headed into clear blue waters or if swampy waters await. If you're wondering about Leejam Sports''s valuation, check out this gauge of its price-to-earnings ratio, as compared to its industry.
Is Leejam Sports Using Its Retained Earnings Effectively?
Leejam Sports has a significant three-year median payout ratio of 54%, meaning that it is left with only 46% to reinvest into its business. This implies that the company has been able to achieve decent earnings growth despite returning most of its profits to shareholders.
Additionally, Leejam Sports has paid dividends over a period of five years which means that the company is pretty serious about sharing its profits with shareholders. Looking at the current analyst consensus data, we can see that the company's future payout ratio is expected to rise to 66% over the next three years. Regardless, the ROE is not expected to change much for the company despite the higher expected payout ratio.
Conclusion
Overall, we are quite pleased with Leejam Sports' performance. In particular, its high ROE is quite noteworthy and also the probable explanation behind its considerable earnings growth. Yet, the company is retaining a small portion of its profits. Which means that the company has been able to grow its earnings in spite of it, so that's not too bad. We also studied the latest analyst forecasts and found that the company's earnings growth is expected be similar to its current growth rate. To know more about the latest analysts predictions for the company, check out this visualization of analyst forecasts for the company.
Valuation is complex, but we're helping make it simple.
Find out whether Leejam Sports is potentially over or undervalued by checking out our comprehensive analysis, which includes fair value estimates, risks and warnings, dividends, insider transactions and financial health.
View the Free AnalysisHave feedback on this article? Concerned about the content? Get in touch with us directly. Alternatively, email editorial-team (at) simplywallst.com.
This article by Simply Wall St is general in nature. We provide commentary based on historical data and analyst forecasts only using an unbiased methodology and our articles are not intended to be financial advice. It does not constitute a recommendation to buy or sell any stock, and does not take account of your objectives, or your financial situation. We aim to bring you long-term focused analysis driven by fundamental data. Note that our analysis may not factor in the latest price-sensitive company announcements or qualitative material. Simply Wall St has no position in any stocks mentioned.
About SASE:1830
Leejam Sports
Leejam Sports Company operates sports and fitness centers in the Kingdom of Saudi Arabia and the United Arab Emirates.
Outstanding track record with adequate balance sheet.

