
Advertisement
- Saudi Arabia
- /
- Luxury
- /
- SASE:4012
Should You Use Thob Al Aseel's (TADAWUL:4012) Statutory Earnings To Analyse It?
It might be old fashioned, but we really like to invest in companies that make a profit, each and every year. Having said that, sometimes statutory profit levels are not a good guide to ongoing profitability, because some short term one-off factor has impacted profit levels. In this article, we'll look at how useful this year's statutory profit is, when analysing Thob Al Aseel (TADAWUL:4012).
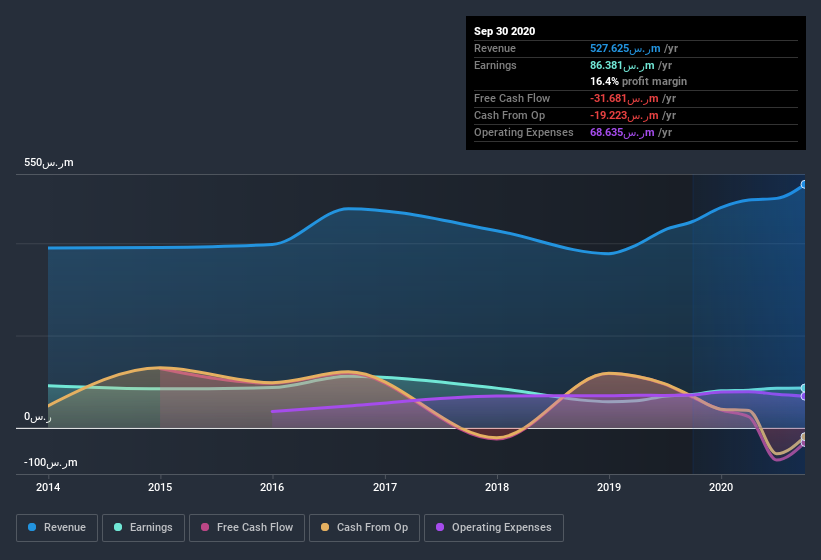
We like the fact that Thob Al Aseel made a profit of ر.س86.4m on its revenue of ر.س527.6m, in the last year. While it managed to grow its revenue over the last three years, its profit has moved in the other direction, as you can see in the chart below.
Check out our latest analysis for Thob Al Aseel
Of course, it is only sensible to look beyond the statutory profits and question how well those numbers represent the sustainable earnings power of the business. As a result, today we're going to take a closer look at Thob Al Aseel's cashflow, and unusual items, with a view to understanding what these might tell us about its statutory profit. Note: we always recommend investors check balance sheet strength. Click here to be taken to our balance sheet analysis of Thob Al Aseel.
Examining Cashflow Against Thob Al Aseel's Earnings
As finance nerds would already know, the accrual ratio from cashflow is a key measure for assessing how well a company's free cash flow (FCF) matches its profit. The accrual ratio subtracts the FCF from the profit for a given period, and divides the result by the average operating assets of the company over that time. This ratio tells us how much of a company's profit is not backed by free cashflow.
Therefore, it's actually considered a good thing when a company has a negative accrual ratio, but a bad thing if its accrual ratio is positive. While it's not a problem to have a positive accrual ratio, indicating a certain level of non-cash profits, a high accrual ratio is arguably a bad thing, because it indicates paper profits are not matched by cash flow. Notably, there is some academic evidence that suggests that a high accrual ratio is a bad sign for near-term profits, generally speaking.
Thob Al Aseel has an accrual ratio of 0.25 for the year to September 2020. Therefore, we know that it's free cashflow was significantly lower than its statutory profit, which is hardly a good thing. In the last twelve months it actually had negative free cash flow, with an outflow of ر.س32m despite its profit of ر.س86.4m, mentioned above. We saw that FCF was ر.س66m a year ago though, so Thob Al Aseel has at least been able to generate positive FCF in the past. However, that's not all there is to consider. The accrual ratio is reflecting the impact of unusual items on statutory profit, at least in part.
The Impact Of Unusual Items On Profit
Unfortunately (in the short term) Thob Al Aseel saw its profit reduced by unusual items worth ر.س17m. If this was a non-cash charge, it would have made the accrual ratio better, if cashflow had stayed strong, so it's not great to see in combination with an uninspiring accrual ratio. While deductions due to unusual items are disappointing in the first instance, there is a silver lining. We looked at thousands of listed companies and found that unusual items are very often one-off in nature. And, after all, that's exactly what the accounting terminology implies. Assuming those unusual expenses don't come up again, we'd therefore expect Thob Al Aseel to produce a higher profit next year, all else being equal.
Our Take On Thob Al Aseel's Profit Performance
Thob Al Aseel saw unusual items weigh on its profit, which should have made it easier to show high cash conversion, which it did not do, according to its accrual ratio. Based on these factors, it's hard to tell if Thob Al Aseel's profits are a reasonable reflection of its underlying profitability. So if you'd like to dive deeper into this stock, it's crucial to consider any risks it's facing. Case in point: We've spotted 3 warning signs for Thob Al Aseel you should be mindful of and 2 of them are a bit concerning.
Our examination of Thob Al Aseel has focussed on certain factors that can make its earnings look better than they are. But there is always more to discover if you are capable of focussing your mind on minutiae. For example, many people consider a high return on equity as an indication of favorable business economics, while others like to 'follow the money' and search out stocks that insiders are buying. So you may wish to see this free collection of companies boasting high return on equity, or this list of stocks that insiders are buying.
When trading Thob Al Aseel or any other investment, use the platform considered by many to be the Professional's Gateway to the Worlds Market, Interactive Brokers. You get the lowest-cost* trading on stocks, options, futures, forex, bonds and funds worldwide from a single integrated account. Promoted
Valuation is complex, but we're here to simplify it.
Discover if Thob Al Aseel might be undervalued or overvalued with our detailed analysis, featuring fair value estimates, potential risks, dividends, insider trades, and its financial condition.
Access Free AnalysisThis article by Simply Wall St is general in nature. It does not constitute a recommendation to buy or sell any stock, and does not take account of your objectives, or your financial situation. We aim to bring you long-term focused analysis driven by fundamental data. Note that our analysis may not factor in the latest price-sensitive company announcements or qualitative material. Simply Wall St has no position in any stocks mentioned.
*Interactive Brokers Rated Lowest Cost Broker by StockBrokers.com Annual Online Review 2020
Have feedback on this article? Concerned about the content? Get in touch with us directly. Alternatively, email editorial-team@simplywallst.com.
About SASE:4012
Thob Al Aseel
Develops, imports, exports, wholesales, and retails fabrics and readymade clothes.
Flawless balance sheet with solid track record and pays a dividend.
Similar Companies
Market Insights

Advertisement
Community Narratives
MicroVision will explode future revenue by 380.37% with a vision towards success
Fair Value US$60|98.4% undervalued
TH
Community Contributor
The Indispensable Artery for a New North American Economy
Fair Value CA$132.87|0.7% overvalued
TI
Community Contributor
Recently Updated Narratives
CO

composite32 on Astor Enerji ·
Astor Enerji will surge with a fair value of $140.43 in the next 3 years
Fair Value:₺140.4335.5% undervalued
1 followerusers have followed this narrative
0 commentsusers have commented on this narrative
0 likesusers have liked this narrative
RE

RecMag on Proximus ·
Proximus: The State-Backed Backup Plan with 7% Gross Yield and 15% Currency Upside.
Fair Value:€17.1356.7% undervalued
30 followersusers have followed this narrative
0 commentsusers have commented on this narrative
0 likesusers have liked this narrative
AG


Agricola on IMPACT Silver ·
A case for for IMPACT Silver Corp (TSXV:IPT) to reach USD $4.52 (CAD $6.16) in 2026 (23 bagger in 1 year) and USD $5.76 (CAD $7.89) by 2030
Fair Value:CA$7.8996.2% undervalued
1 followerusers have followed this narrative
0 commentsusers have commented on this narrative
0 likesusers have liked this narrative
Popular Narratives
TH

TheWallstreetKing on MicroVision ·
MicroVision will explode future revenue by 380.37% with a vision towards success
Fair Value:US$6098.4% undervalued
101 followersusers have followed this narrative
10 commentsusers have commented on this narrative
20 likesusers have liked this narrative
OS


oscargarcia on Alphabet ·
The company that turned a verb into a global necessity and basically runs the modern internet, digital ads, smartphones, maps, and AI.
Fair Value:US$3405.8% undervalued
138 followersusers have followed this narrative
6 commentsusers have commented on this narrative
18 likesusers have liked this narrative
AN


AnalystConsensusTarget on NVIDIA ·
NVDA: Expanding AI Demand Will Drive Major Data Center Investments Through 2026
Fair Value:US$250.3929.3% undervalued
930 followersusers have followed this narrative
6 commentsusers have commented on this narrative
23 likesusers have liked this narrative