
Advertisement
S.C. Semrom Oltenia S.A. (BVB:SEOL) Is Going Strong But Fundamentals Appear To Be Mixed : Is There A Clear Direction For The Stock?

S.C. Semrom Oltenia (BVB:SEOL) has had a great run on the share market with its stock up by a significant 113% over the last three months. However, we decided to pay attention to the company's fundamentals which don't appear to give a clear sign about the company's financial health. Specifically, we decided to study S.C. Semrom Oltenia's ROE in this article.
ROE or return on equity is a useful tool to assess how effectively a company can generate returns on the investment it received from its shareholders. In short, ROE shows the profit each dollar generates with respect to its shareholder investments.
How Is ROE Calculated?
ROE can be calculated by using the formula:
Return on Equity = Net Profit (from continuing operations) ÷ Shareholders' Equity
So, based on the above formula, the ROE for S.C. Semrom Oltenia is:
3.2% = RON579k ÷ RON18m (Based on the trailing twelve months to December 2024).
The 'return' is the income the business earned over the last year. So, this means that for every RON1 of its shareholder's investments, the company generates a profit of RON0.03.
Check out our latest analysis for S.C. Semrom Oltenia
What Has ROE Got To Do With Earnings Growth?
Thus far, we have learned that ROE measures how efficiently a company is generating its profits. Based on how much of its profits the company chooses to reinvest or "retain", we are then able to evaluate a company's future ability to generate profits. Assuming everything else remains unchanged, the higher the ROE and profit retention, the higher the growth rate of a company compared to companies that don't necessarily bear these characteristics.
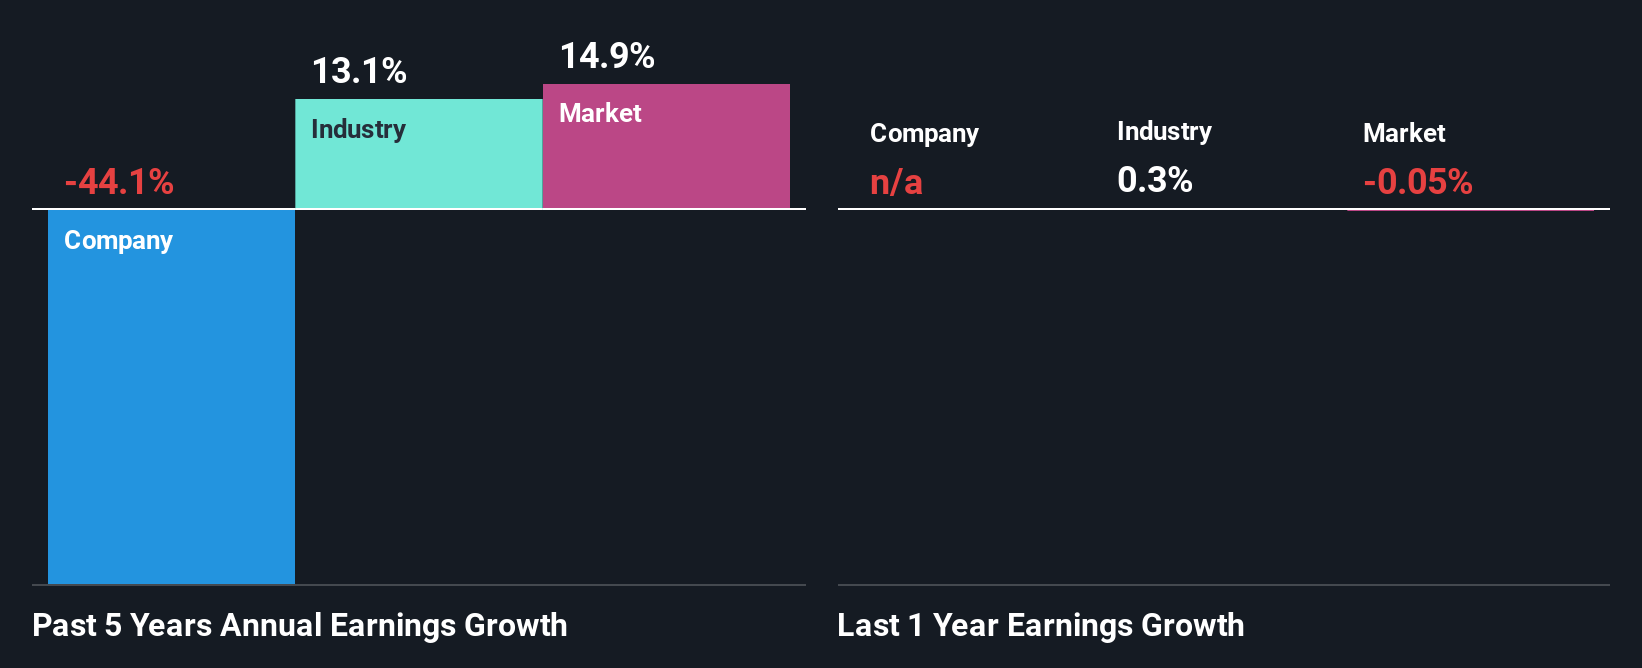
S.C. Semrom Oltenia's Earnings Growth And 3.2% ROE
It is quite clear that S.C. Semrom Oltenia's ROE is rather low. Further, we noted that the company's ROE is similar to the industry average of 3.2%. Given the low ROE S.C. Semrom Oltenia's five year net income decline of 44% is not surprising.
That being said, we compared S.C. Semrom Oltenia's performance with the industry and were concerned when we found that while the company has shrunk its earnings, the industry has grown its earnings at a rate of 13% in the same 5-year period.
Earnings growth is an important metric to consider when valuing a stock. It’s important for an investor to know whether the market has priced in the company's expected earnings growth (or decline). This then helps them determine if the stock is placed for a bright or bleak future. Is S.C. Semrom Oltenia fairly valued compared to other companies? These 3 valuation measures might help you decide.
Is S.C. Semrom Oltenia Using Its Retained Earnings Effectively?
Despite having a normal three-year median payout ratio of 36% (where it is retaining 64% of its profits), S.C. Semrom Oltenia has seen a decline in earnings as we saw above. It looks like there might be some other reasons to explain the lack in that respect. For example, the business could be in decline.
Additionally, S.C. Semrom Oltenia started paying a dividend only recently. So it looks like the management may have perceived that shareholders favor dividends even though earnings have been in decline.
Summary
In total, we're a bit ambivalent about S.C. Semrom Oltenia's performance. While the company does have a high rate of profit retention, its low rate of return is probably hampering its earnings growth. Wrapping up, we would proceed with caution with this company and one way of doing that would be to look at the risk profile of the business. Our risks dashboard would have the 4 risks we have identified for S.C. Semrom Oltenia.
New: Manage All Your Stock Portfolios in One Place
We've created the ultimate portfolio companion for stock investors, and it's free.
• Connect an unlimited number of Portfolios and see your total in one currency
• Be alerted to new Warning Signs or Risks via email or mobile
• Track the Fair Value of your stocks
Have feedback on this article? Concerned about the content? Get in touch with us directly. Alternatively, email editorial-team (at) simplywallst.com.
This article by Simply Wall St is general in nature. We provide commentary based on historical data and analyst forecasts only using an unbiased methodology and our articles are not intended to be financial advice. It does not constitute a recommendation to buy or sell any stock, and does not take account of your objectives, or your financial situation. We aim to bring you long-term focused analysis driven by fundamental data. Note that our analysis may not factor in the latest price-sensitive company announcements or qualitative material. Simply Wall St has no position in any stocks mentioned.
About BVB:SEOL
S.C. Semrom Oltenia
S.C. Semrom Oltenia S.A. grows and sells cereals, leguminous, and oleaginous plants in Romania.
Flawless balance sheet slight.
Market Insights

Advertisement
Community Narratives
The Future of Drug Testing? Fingerprint Tech Shows Serious Promise
Fair Value US$2.98|38.8% undervalued
JO
Community Contributor
Occidental Petroleum is set to achieve a 16% profit margin improvement
Fair Value US$55.05|20.2% undervalued
DZ
Community Contributor
Argan's Revenue Set to Soar with a 13.31% Growth in the Coming Decade
Fair Value US$284.68|26.4% undervalued
KE
Community Contributor
EU#1 - From German Startup to EU’s Biggest Company
Fair Value €248.62|6.9% overvalued
TO
Community Contributor