- Qatar
- /
- Telecom Services and Carriers
- /
- DSM:ORDS
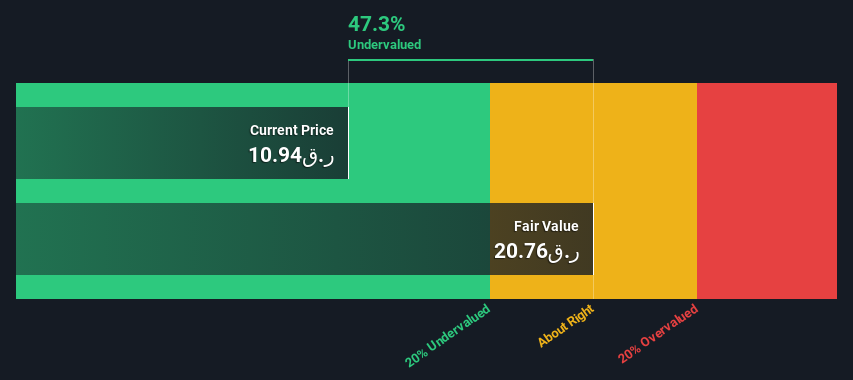
Are Investors Undervaluing Ooredoo Q.P.S.C. (DSM:ORDS) By 47%?


Key Insights
- Using the 2 Stage Free Cash Flow to Equity, Ooredoo Q.P.S.C fair value estimate is ر.ق20.76
- Ooredoo Q.P.S.C's ر.ق10.94 share price signals that it might be 47% undervalued
- Our fair value estimate is 82% higher than Ooredoo Q.P.S.C's analyst price target of ر.ق11.42
Today we'll do a simple run through of a valuation method used to estimate the attractiveness of Ooredoo Q.P.S.C. (DSM:ORDS) as an investment opportunity by estimating the company's future cash flows and discounting them to their present value. We will use the Discounted Cash Flow (DCF) model on this occasion. There's really not all that much to it, even though it might appear quite complex.
We would caution that there are many ways of valuing a company and, like the DCF, each technique has advantages and disadvantages in certain scenarios. If you still have some burning questions about this type of valuation, take a look at the Simply Wall St analysis model.
Check out our latest analysis for Ooredoo Q.P.S.C
Step By Step Through The Calculation
We use what is known as a 2-stage model, which simply means we have two different periods of growth rates for the company's cash flows. Generally the first stage is higher growth, and the second stage is a lower growth phase. To begin with, we have to get estimates of the next ten years of cash flows. Where possible we use analyst estimates, but when these aren't available we extrapolate the previous free cash flow (FCF) from the last estimate or reported value. We assume companies with shrinking free cash flow will slow their rate of shrinkage, and that companies with growing free cash flow will see their growth rate slow, over this period. We do this to reflect that growth tends to slow more in the early years than it does in later years.
Generally we assume that a dollar today is more valuable than a dollar in the future, so we discount the value of these future cash flows to their estimated value in today's dollars:
10-year free cash flow (FCF) forecast
| 2023 | 2024 | 2025 | 2026 | 2027 | 2028 | 2029 | 2030 | 2031 | 2032 | |
| Levered FCF (QAR, Millions) | ر.ق3.06b | ر.ق4.18b | ر.ق4.54b | ر.ق4.91b | ر.ق5.32b | ر.ق5.77b | ر.ق6.27b | ر.ق6.82b | ر.ق7.42b | ر.ق8.08b |
| Growth Rate Estimate Source | Analyst x2 | Analyst x1 | Analyst x1 | Est @ 8.08% | Est @ 8.35% | Est @ 8.54% | Est @ 8.68% | Est @ 8.77% | Est @ 8.84% | Est @ 8.88% |
| Present Value (QAR, Millions) Discounted @ 15% | ر.ق2.7k | ر.ق3.2k | ر.ق3.0k | ر.ق2.8k | ر.ق2.7k | ر.ق2.6k | ر.ق2.4k | ر.ق2.3k | ر.ق2.2k | ر.ق2.1k |
("Est" = FCF growth rate estimated by Simply Wall St)
Present Value of 10-year Cash Flow (PVCF) = ر.ق26b
The second stage is also known as Terminal Value, this is the business's cash flow after the first stage. The Gordon Growth formula is used to calculate Terminal Value at a future annual growth rate equal to the 5-year average of the 10-year government bond yield of 9.0%. We discount the terminal cash flows to today's value at a cost of equity of 15%.
Terminal Value (TV)= FCF2032 × (1 + g) ÷ (r – g) = ر.ق8.1b× (1 + 9.0%) ÷ (15%– 9.0%) = ر.ق158b
Present Value of Terminal Value (PVTV)= TV / (1 + r)10= ر.ق158b÷ ( 1 + 15%)10= ر.ق41b
The total value, or equity value, is then the sum of the present value of the future cash flows, which in this case is ر.ق66b. In the final step we divide the equity value by the number of shares outstanding. Compared to the current share price of ر.ق10.9, the company appears quite good value at a 47% discount to where the stock price trades currently. The assumptions in any calculation have a big impact on the valuation, so it is better to view this as a rough estimate, not precise down to the last cent.
The Assumptions
The calculation above is very dependent on two assumptions. The first is the discount rate and the other is the cash flows. If you don't agree with these result, have a go at the calculation yourself and play with the assumptions. The DCF also does not consider the possible cyclicality of an industry, or a company's future capital requirements, so it does not give a full picture of a company's potential performance. Given that we are looking at Ooredoo Q.P.S.C as potential shareholders, the cost of equity is used as the discount rate, rather than the cost of capital (or weighted average cost of capital, WACC) which accounts for debt. In this calculation we've used 15%, which is based on a levered beta of 0.800. Beta is a measure of a stock's volatility, compared to the market as a whole. We get our beta from the industry average beta of globally comparable companies, with an imposed limit between 0.8 and 2.0, which is a reasonable range for a stable business.
SWOT Analysis for Ooredoo Q.P.S.C
- Earnings growth over the past year exceeded the industry.
- Debt is not viewed as a risk.
- Dividends are covered by earnings and cash flows.
- Dividend is low compared to the top 25% of dividend payers in the Telecom market.
- Annual earnings are forecast to grow for the next 3 years.
- Good value based on P/E ratio and estimated fair value.
- Annual earnings are forecast to grow slower than the Qatari market.
Moving On:
Although the valuation of a company is important, it ideally won't be the sole piece of analysis you scrutinize for a company. It's not possible to obtain a foolproof valuation with a DCF model. Rather it should be seen as a guide to "what assumptions need to be true for this stock to be under/overvalued?" For example, changes in the company's cost of equity or the risk free rate can significantly impact the valuation. What is the reason for the share price sitting below the intrinsic value? For Ooredoo Q.P.S.C, we've compiled three additional elements you should assess:
- Risks: Every company has them, and we've spotted 1 warning sign for Ooredoo Q.P.S.C you should know about.
- Future Earnings: How does ORDS's growth rate compare to its peers and the wider market? Dig deeper into the analyst consensus number for the upcoming years by interacting with our free analyst growth expectation chart.
- Other High Quality Alternatives: Do you like a good all-rounder? Explore our interactive list of high quality stocks to get an idea of what else is out there you may be missing!
PS. The Simply Wall St app conducts a discounted cash flow valuation for every stock on the DSM every day. If you want to find the calculation for other stocks just search here.
New: AI Stock Screener & Alerts
Our new AI Stock Screener scans the market every day to uncover opportunities.
• Dividend Powerhouses (3%+ Yield)
• Undervalued Small Caps with Insider Buying
• High growth Tech and AI Companies
Or build your own from over 50 metrics.
Have feedback on this article? Concerned about the content? Get in touch with us directly. Alternatively, email editorial-team (at) simplywallst.com.
This article by Simply Wall St is general in nature. We provide commentary based on historical data and analyst forecasts only using an unbiased methodology and our articles are not intended to be financial advice. It does not constitute a recommendation to buy or sell any stock, and does not take account of your objectives, or your financial situation. We aim to bring you long-term focused analysis driven by fundamental data. Note that our analysis may not factor in the latest price-sensitive company announcements or qualitative material. Simply Wall St has no position in any stocks mentioned.
About DSM:ORDS
Ooredoo Q.P.S.C
Provides telecommunications services in Qatar, Asia, rest of the Middle East, and North Africa region.
Flawless balance sheet, undervalued and pays a dividend.

