Advertisement
- Portugal
- /
- Oil and Gas
- /
- ENXTLS:GALP
Galp Energia (ENXTLS:GALP): Assessing Valuation Following Raised Full-Year Outlook on Q3 Results

Simply Wall St
Reviewed by Simply Wall St
Galp Energia SGPS (ENXTLS:GALP) just shared its third-quarter 2025 results, highlighting its confidence to beat full-year adjusted earnings and cash flow targets. This comes even as the company navigates softer oil prices.
See our latest analysis for Galp Energia SGPS.
Despite a dip in oil prices and year-on-year revenue declines, Galp’s confidence and upward guidance have kept momentum on its side. The stock’s share price has climbed 4.6% over the past month and its total shareholder return over the last year stands at 14%. This builds on an impressive 78% three-year total return.
If Galp’s progress has you thinking bigger, consider exploring fast growing stocks with high insider ownership as your next step for discovering standout opportunities across the market.
With shares gaining ground and management sounding upbeat, the big question for investors is whether Galp is still trading at a discount that reflects its true potential, or if future upside is already factored into the price.
Price-to-Earnings of 12.4x: Is it justified?
Galp trades at a price-to-earnings (P/E) ratio of 12.4x, which is notably lower than both its peer group and the broader Oil and Gas sector. With the last close at €17.4, this suggests the stock is pricing in less upside than competitors, potentially leaving room for re-rating if fundamentals hold up.
The price-to-earnings ratio reflects how much investors are willing to pay for each euro of Galp’s profits. In the energy sector, this figure serves as a key benchmark for gauging market sentiment around growth prospects, profitability, and sector risk. A lower P/E relative to peers means the market is assigning less value to Galp’s earnings, either due to perceived headwinds or skepticism over future growth.
Compared to the European Oil and Gas industry average P/E of 14.3x and the peer average of 16.3x, Galp’s valuation stands out as attractive. The comparably low multiple may indicate the stock is being undervalued by investors relative to its sector, despite recent gains and management’s positive tone.
See what the numbers say about this price — find out in our valuation breakdown.
Result: Price-to-Earnings of 12.4x (UNDERVALUED)
However, slowing revenue growth and flat net income suggest that market optimism could decrease if Galp fails to deliver sustained earnings momentum.
Find out about the key risks to this Galp Energia SGPS narrative.
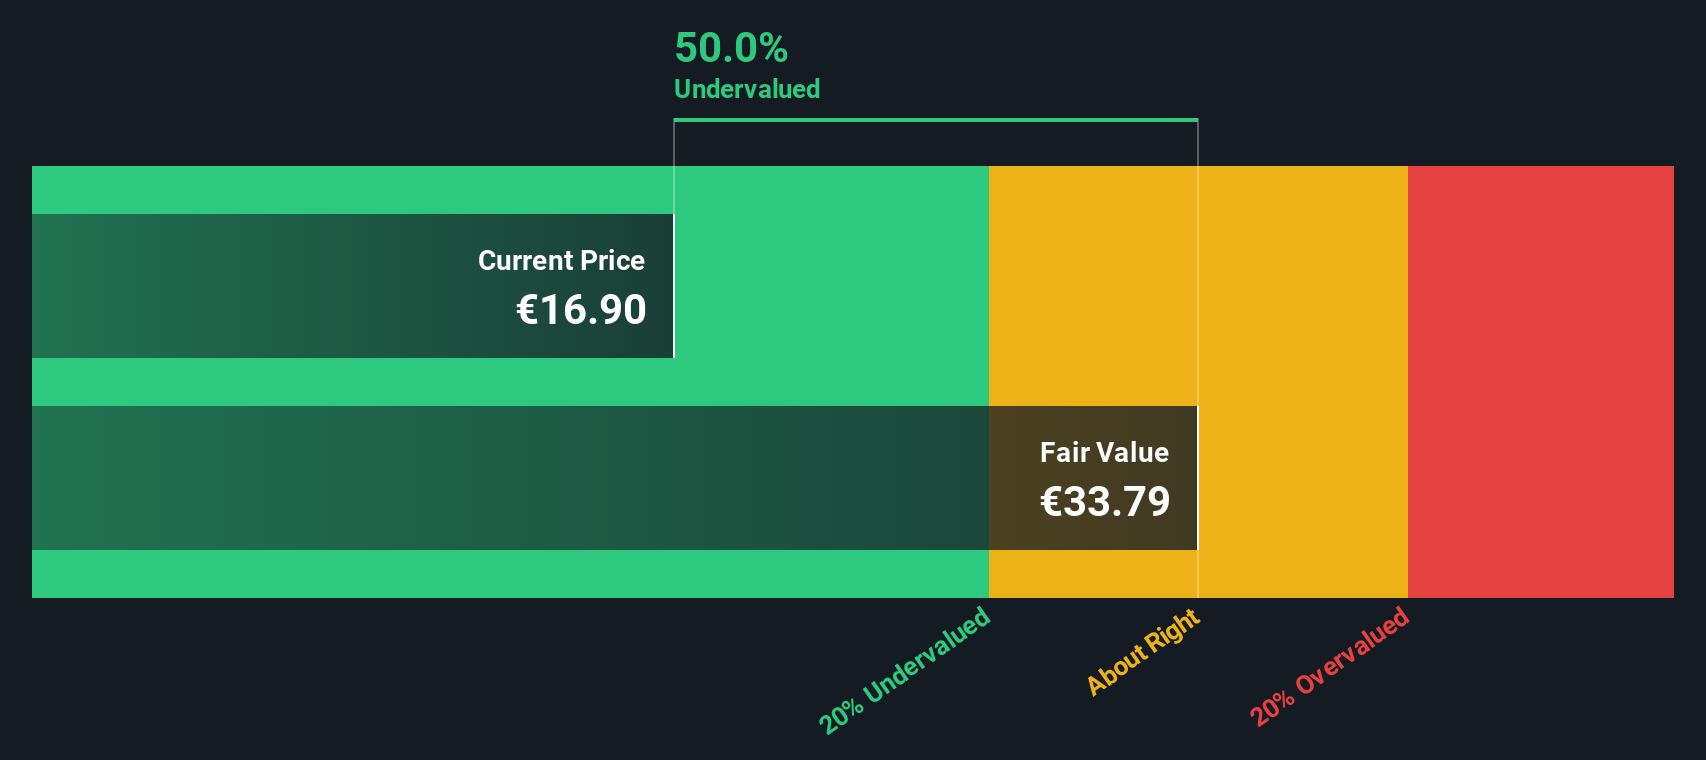
Another View: Discounted Cash Flow Sheds Different Light
While Galp’s low price-to-earnings ratio might imply undervaluation, our DCF model offers a contrasting perspective. Based on the SWS DCF analysis, Galp's shares are trading around 47% below their estimated fair value. Does this suggest a significant opportunity, or is the market pricing in hidden risks?
Look into how the SWS DCF model arrives at its fair value.
Simply Wall St performs a discounted cash flow (DCF) on every stock in the world every day (check out Galp Energia SGPS for example). We show the entire calculation in full. You can track the result in your watchlist or portfolio and be alerted when this changes, or use our stock screener to discover 834 undervalued stocks based on their cash flows. If you save a screener we even alert you when new companies match - so you never miss a potential opportunity.
Build Your Own Galp Energia SGPS Narrative
If you want a second opinion or think there’s more to the story, you can dig into the data and shape your own perspective in just a few minutes, Do it your way.
A great starting point for your Galp Energia SGPS research is our analysis highlighting 1 key reward and 2 important warning signs that could impact your investment decision.
Looking for more investment ideas?
Find your next compelling opportunity today and stay ahead as the market shifts. Top-performing stocks can move fast, so don’t sit on the sidelines.
- Target reliable income streams and grow your portfolio by checking out these 24 dividend stocks with yields > 3% with yields above 3%.
- Capitalize on the explosive growth in artificial intelligence by reviewing these 26 AI penny stocks changing the industry with breakthroughs and innovation.
- Spot tomorrow’s market leaders early by accessing these 3582 penny stocks with strong financials boasting strong financials and big potential.
This article by Simply Wall St is general in nature. We provide commentary based on historical data and analyst forecasts only using an unbiased methodology and our articles are not intended to be financial advice. It does not constitute a recommendation to buy or sell any stock, and does not take account of your objectives, or your financial situation. We aim to bring you long-term focused analysis driven by fundamental data. Note that our analysis may not factor in the latest price-sensitive company announcements or qualitative material. Simply Wall St has no position in any stocks mentioned.
New: Manage All Your Stock Portfolios in One Place
We've created the ultimate portfolio companion for stock investors, and it's free.
• Connect an unlimited number of Portfolios and see your total in one currency
• Be alerted to new Warning Signs or Risks via email or mobile
• Track the Fair Value of your stocks
Have feedback on this article? Concerned about the content? Get in touch with us directly. Alternatively, email editorial-team@simplywallst.com
About ENXTLS:GALP
Galp Energia SGPS
Operates as an integrated energy operator in Portugal and internationally.
Excellent balance sheet, good value and pays a dividend.
Similar Companies
Market Insights

Advertisement
Community Narratives
The company that turned a verb into a global necessity and basically runs the modern internet, digital ads, smartphones, maps, and AI.
Fair Value US$300.00|6.2% undervalued
OS
Community Contributor
Flowers Foods Pays A Fair Price For Health
Fair Value US$16.12|25.1% undervalued
NV
Community Contributor
TMX Group will thrive with 33.3% profit margin and enduring market moat
Fair Value CA$49.90|0.04% overvalued
LI
Community Contributor