Stock Analysis
- Portugal
- /
- Food and Staples Retail
- /
- ENXTLS:JMT
Jerónimo Martins SGPS (ELI:JMT) jumps 4.7% this week, though earnings growth is still tracking behind five-year shareholder returns


Stock pickers are generally looking for stocks that will outperform the broader market. Buying under-rated businesses is one path to excess returns. For example, the Jerónimo Martins, SGPS, S.A. (ELI:JMT) share price is up 48% in the last 5 years, clearly besting the market return of around 28% (ignoring dividends).
On the back of a solid 7-day performance, let's check what role the company's fundamentals have played in driving long term shareholder returns.
Check out our latest analysis for Jerónimo Martins SGPS
To quote Buffett, 'Ships will sail around the world but the Flat Earth Society will flourish. There will continue to be wide discrepancies between price and value in the marketplace...' By comparing earnings per share (EPS) and share price changes over time, we can get a feel for how investor attitudes to a company have morphed over time.
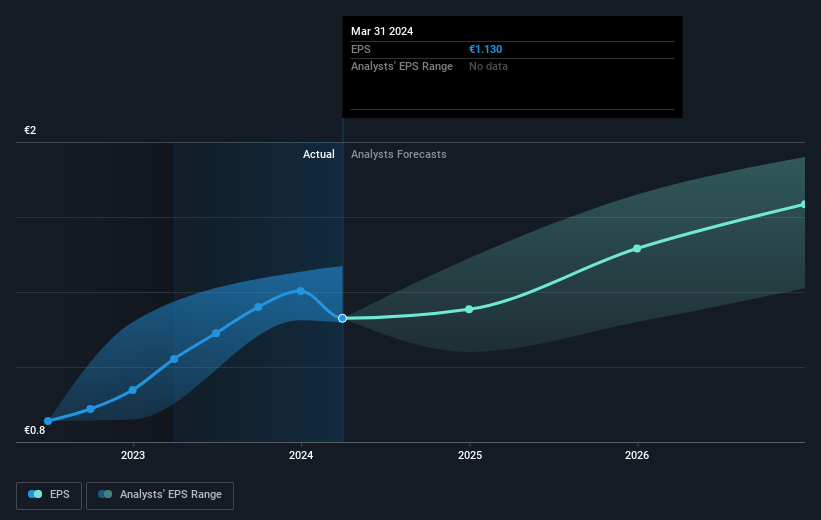
During five years of share price growth, Jerónimo Martins SGPS achieved compound earnings per share (EPS) growth of 14% per year. This EPS growth is higher than the 8% average annual increase in the share price. So it seems the market isn't so enthusiastic about the stock these days.
You can see below how EPS has changed over time (discover the exact values by clicking on the image).
We're pleased to report that the CEO is remunerated more modestly than most CEOs at similarly capitalized companies. It's always worth keeping an eye on CEO pay, but a more important question is whether the company will grow earnings throughout the years. This free interactive report on Jerónimo Martins SGPS' earnings, revenue and cash flow is a great place to start, if you want to investigate the stock further.
What About Dividends?
It is important to consider the total shareholder return, as well as the share price return, for any given stock. The TSR incorporates the value of any spin-offs or discounted capital raisings, along with any dividends, based on the assumption that the dividends are reinvested. So for companies that pay a generous dividend, the TSR is often a lot higher than the share price return. We note that for Jerónimo Martins SGPS the TSR over the last 5 years was 71%, which is better than the share price return mentioned above. This is largely a result of its dividend payments!
A Different Perspective
Jerónimo Martins SGPS shareholders are down 5.8% for the year (even including dividends), but the market itself is up 4.5%. Even the share prices of good stocks drop sometimes, but we want to see improvements in the fundamental metrics of a business, before getting too interested. Longer term investors wouldn't be so upset, since they would have made 11%, each year, over five years. It could be that the recent sell-off is an opportunity, so it may be worth checking the fundamental data for signs of a long term growth trend. I find it very interesting to look at share price over the long term as a proxy for business performance. But to truly gain insight, we need to consider other information, too. To that end, you should be aware of the 1 warning sign we've spotted with Jerónimo Martins SGPS .
If you are like me, then you will not want to miss this free list of undervalued small caps that insiders are buying.
Please note, the market returns quoted in this article reflect the market weighted average returns of stocks that currently trade on Portuguese exchanges.
Valuation is complex, but we're helping make it simple.
Find out whether Jerónimo Martins SGPS is potentially over or undervalued by checking out our comprehensive analysis, which includes fair value estimates, risks and warnings, dividends, insider transactions and financial health.
View the Free AnalysisHave feedback on this article? Concerned about the content? Get in touch with us directly. Alternatively, email editorial-team (at) simplywallst.com.
This article by Simply Wall St is general in nature. We provide commentary based on historical data and analyst forecasts only using an unbiased methodology and our articles are not intended to be financial advice. It does not constitute a recommendation to buy or sell any stock, and does not take account of your objectives, or your financial situation. We aim to bring you long-term focused analysis driven by fundamental data. Note that our analysis may not factor in the latest price-sensitive company announcements or qualitative material. Simply Wall St has no position in any stocks mentioned.
About ENXTLS:JMT
Jerónimo Martins SGPS
Operates in the food distribution and specialized retail sectors in Portugal, Poland, and Colombia.
Excellent balance sheet with reasonable growth potential and pays a dividend.

