
Advertisement
Here's Why Sygnity's (WSE:SGN) Statutory Earnings Are Arguably Too Conservative
As a general rule, we think profitable companies are less risky than companies that lose money. Having said that, sometimes statutory profit levels are not a good guide to ongoing profitability, because some short term one-off factor has impacted profit levels. In this article, we'll look at how useful this year's statutory profit is, when analysing Sygnity (WSE:SGN).
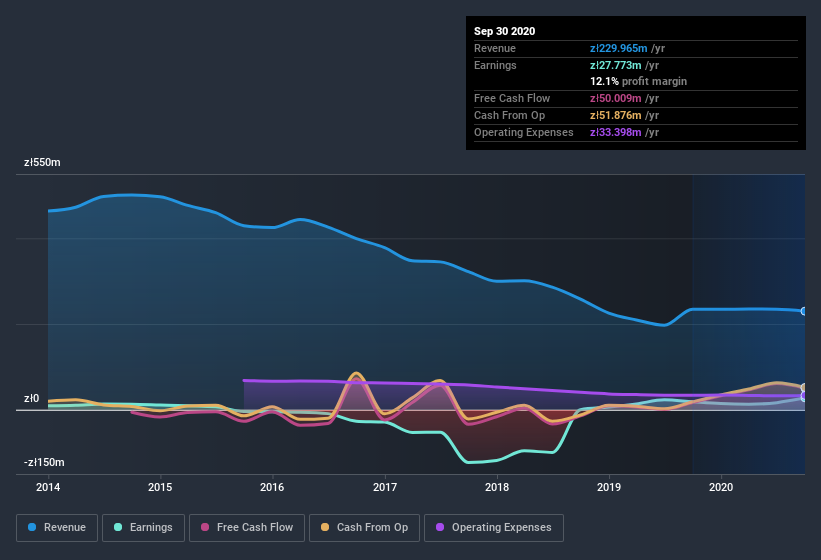
It's good to see that over the last twelve months Sygnity made a profit of zł27.8m on revenue of zł230.0m. The chart below shows that while revenue has fallen over the last three years, the company has moved from unprofitable to profitable.
Check out our latest analysis for Sygnity
Of course, it is only sensible to look beyond the statutory profits and question how well those numbers represent the sustainable earnings power of the business. So today we'll look at what Sygnity's cashflow tells us about the quality of its earnings. That might leave you wondering what analysts are forecasting in terms of future profitability. Luckily, you can click here to see an interactive graph depicting future profitability, based on their estimates.
A Closer Look At Sygnity's Earnings
As finance nerds would already know, the accrual ratio from cashflow is a key measure for assessing how well a company's free cash flow (FCF) matches its profit. In plain english, this ratio subtracts FCF from net profit, and divides that number by the company's average operating assets over that period. The ratio shows us how much a company's profit exceeds its FCF.
Therefore, it's actually considered a good thing when a company has a negative accrual ratio, but a bad thing if its accrual ratio is positive. That is not intended to imply we should worry about a positive accrual ratio, but it's worth noting where the accrual ratio is rather high. That's because some academic studies have suggested that high accruals ratios tend to lead to lower profit or less profit growth.
Over the twelve months to September 2020, Sygnity recorded an accrual ratio of -0.28. Therefore, its statutory earnings were very significantly less than its free cashflow. In fact, it had free cash flow of zł50m in the last year, which was a lot more than its statutory profit of zł27.8m. Sygnity's free cash flow improved over the last year, which is generally good to see.
Our Take On Sygnity's Profit Performance
As we discussed above, Sygnity's accrual ratio indicates strong conversion of profit to free cash flow, which is a positive for the company. Because of this, we think Sygnity's underlying earnings potential is as good as, or possibly even better, than the statutory profit makes it seem! And the EPS is up 41% over the last twelve months. Of course, we've only just scratched the surface when it comes to analysing its earnings; one could also consider margins, forecast growth, and return on investment, among other factors. Keep in mind, when it comes to analysing a stock it's worth noting the risks involved. Every company has risks, and we've spotted 1 warning sign for Sygnity you should know about.
Today we've zoomed in on a single data point to better understand the nature of Sygnity's profit. But there is always more to discover if you are capable of focussing your mind on minutiae. For example, many people consider a high return on equity as an indication of favorable business economics, while others like to 'follow the money' and search out stocks that insiders are buying. So you may wish to see this free collection of companies boasting high return on equity, or this list of stocks that insiders are buying.
When trading Sygnity or any other investment, use the platform considered by many to be the Professional's Gateway to the Worlds Market, Interactive Brokers. You get the lowest-cost* trading on stocks, options, futures, forex, bonds and funds worldwide from a single integrated account. Promoted
New: Manage All Your Stock Portfolios in One Place
We've created the ultimate portfolio companion for stock investors, and it's free.
• Connect an unlimited number of Portfolios and see your total in one currency
• Be alerted to new Warning Signs or Risks via email or mobile
• Track the Fair Value of your stocks
This article by Simply Wall St is general in nature. It does not constitute a recommendation to buy or sell any stock, and does not take account of your objectives, or your financial situation. We aim to bring you long-term focused analysis driven by fundamental data. Note that our analysis may not factor in the latest price-sensitive company announcements or qualitative material. Simply Wall St has no position in any stocks mentioned.
*Interactive Brokers Rated Lowest Cost Broker by StockBrokers.com Annual Online Review 2020
Have feedback on this article? Concerned about the content? Get in touch with us directly. Alternatively, email editorial-team (at) simplywallst.com.
About WSE:SGN
Sygnity
Manufactures and sells IT products and services in Poland and internationally.
Outstanding track record with flawless balance sheet.
Market Insights

Advertisement
Community Narratives
MicroVision will explode future revenue by 380.37% with a vision towards success
Fair Value US$60.00|98.5% undervalued
TH
Community Contributor
The Indispensable Artery for a New North American Economy
Fair Value CA$132.87|2.3% undervalued
TI
Community Contributor