Stock Analysis
Should Weakness in Pepco Group N.V.'s (WSE:PCO) Stock Be Seen As A Sign That Market Will Correct The Share Price Given Decent Financials?


Pepco Group (WSE:PCO) has had a rough three months with its share price down 28%. But if you pay close attention, you might find that its key financial indicators look quite decent, which could mean that the stock could potentially rise in the long-term given how markets usually reward more resilient long-term fundamentals. In this article, we decided to focus on Pepco Group's ROE.
ROE or return on equity is a useful tool to assess how effectively a company can generate returns on the investment it received from its shareholders. In other words, it is a profitability ratio which measures the rate of return on the capital provided by the company's shareholders.
View our latest analysis for Pepco Group
How Do You Calculate Return On Equity?
Return on equity can be calculated by using the formula:
Return on Equity = Net Profit (from continuing operations) ÷ Shareholders' Equity
So, based on the above formula, the ROE for Pepco Group is:
8.8% = €102m ÷ €1.2b (Based on the trailing twelve months to September 2023).
The 'return' refers to a company's earnings over the last year. One way to conceptualize this is that for each PLN1 of shareholders' capital it has, the company made PLN0.09 in profit.
What Is The Relationship Between ROE And Earnings Growth?
So far, we've learned that ROE is a measure of a company's profitability. Based on how much of its profits the company chooses to reinvest or "retain", we are then able to evaluate a company's future ability to generate profits. Assuming everything else remains unchanged, the higher the ROE and profit retention, the higher the growth rate of a company compared to companies that don't necessarily bear these characteristics.
A Side By Side comparison of Pepco Group's Earnings Growth And 8.8% ROE
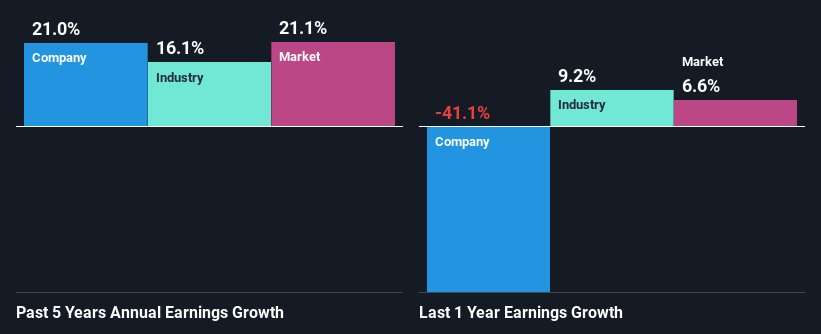
At first glance, Pepco Group's ROE doesn't look very promising. We then compared the company's ROE to the broader industry and were disappointed to see that the ROE is lower than the industry average of 13%. However, we we're pleasantly surprised to see that Pepco Group grew its net income at a significant rate of 21% in the last five years. We reckon that there could be other factors at play here. Such as - high earnings retention or an efficient management in place.
We then compared Pepco Group's net income growth with the industry and we're pleased to see that the company's growth figure is higher when compared with the industry which has a growth rate of 16% in the same 5-year period.
The basis for attaching value to a company is, to a great extent, tied to its earnings growth. What investors need to determine next is if the expected earnings growth, or the lack of it, is already built into the share price. By doing so, they will have an idea if the stock is headed into clear blue waters or if swampy waters await. What is PCO worth today? The intrinsic value infographic in our free research report helps visualize whether PCO is currently mispriced by the market.
Is Pepco Group Efficiently Re-investing Its Profits?
Pepco Group doesn't pay any dividend to its shareholders, meaning that the company has been reinvesting all of its profits into the business. This is likely what's driving the high earnings growth number discussed above.
Summary
In total, it does look like Pepco Group has some positive aspects to its business. Even in spite of the low rate of return, the company has posted impressive earnings growth as a result of reinvesting heavily into its business. That being so, the latest analyst forecasts show that the company will continue to see an expansion in its earnings. To know more about the company's future earnings growth forecasts take a look at this free report on analyst forecasts for the company to find out more.
Valuation is complex, but we're helping make it simple.
Find out whether Pepco Group is potentially over or undervalued by checking out our comprehensive analysis, which includes fair value estimates, risks and warnings, dividends, insider transactions and financial health.
View the Free AnalysisHave feedback on this article? Concerned about the content? Get in touch with us directly. Alternatively, email editorial-team (at) simplywallst.com.
This article by Simply Wall St is general in nature. We provide commentary based on historical data and analyst forecasts only using an unbiased methodology and our articles are not intended to be financial advice. It does not constitute a recommendation to buy or sell any stock, and does not take account of your objectives, or your financial situation. We aim to bring you long-term focused analysis driven by fundamental data. Note that our analysis may not factor in the latest price-sensitive company announcements or qualitative material. Simply Wall St has no position in any stocks mentioned.
About WSE:PCO
Pepco Group
Pepco Group N.V. operates as a discount variety retailer in the United Kingdom, the Republic of Ireland, Poland, and rest of Europe.
Good value with reasonable growth potential.
