Stock Analysis
- Poland
- /
- Entertainment
- /
- WSE:SMT
Simteract S.A.'s (WSE:SMT) Stock is Soaring But Financials Seem Inconsistent: Will The Uptrend Continue?


Simteract (WSE:SMT) has had a great run on the share market with its stock up by a significant 22% over the last three months. But the company's key financial indicators appear to be differing across the board and that makes us question whether or not the company's current share price momentum can be maintained. Particularly, we will be paying attention to Simteract's ROE today.
Return on equity or ROE is a key measure used to assess how efficiently a company's management is utilizing the company's capital. In short, ROE shows the profit each dollar generates with respect to its shareholder investments.
View our latest analysis for Simteract
How Do You Calculate Return On Equity?
Return on equity can be calculated by using the formula:
Return on Equity = Net Profit (from continuing operations) ÷ Shareholders' Equity
So, based on the above formula, the ROE for Simteract is:
6.5% = zł468k ÷ zł7.2m (Based on the trailing twelve months to March 2024).
The 'return' refers to a company's earnings over the last year. That means that for every PLN1 worth of shareholders' equity, the company generated PLN0.06 in profit.
Why Is ROE Important For Earnings Growth?
We have already established that ROE serves as an efficient profit-generating gauge for a company's future earnings. Depending on how much of these profits the company reinvests or "retains", and how effectively it does so, we are then able to assess a company’s earnings growth potential. Assuming all else is equal, companies that have both a higher return on equity and higher profit retention are usually the ones that have a higher growth rate when compared to companies that don't have the same features.
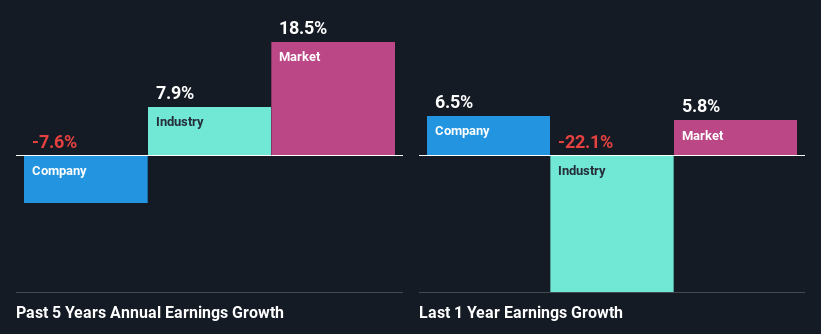
Simteract's Earnings Growth And 6.5% ROE
On the face of it, Simteract's ROE is not much to talk about. A quick further study shows that the company's ROE doesn't compare favorably to the industry average of 14% either. Therefore, it might not be wrong to say that the five year net income decline of 7.6% seen by Simteract was probably the result of it having a lower ROE. We reckon that there could also be other factors at play here. For instance, the company has a very high payout ratio, or is faced with competitive pressures.
That being said, we compared Simteract's performance with the industry and were concerned when we found that while the company has shrunk its earnings, the industry has grown its earnings at a rate of 7.9% in the same 5-year period.
Earnings growth is an important metric to consider when valuing a stock. The investor should try to establish if the expected growth or decline in earnings, whichever the case may be, is priced in. This then helps them determine if the stock is placed for a bright or bleak future. Is Simteract fairly valued compared to other companies? These 3 valuation measures might help you decide.
Is Simteract Efficiently Re-investing Its Profits?
Simteract doesn't pay any regular dividends, meaning that the company is keeping all of its profits, which makes us wonder why it is retaining its earnings if it can't use them to grow its business. So there could be some other explanations in that regard. For instance, the company's business may be deteriorating.
Summary
On the whole, we feel that the performance shown by Simteract can be open to many interpretations. Even though it appears to be retaining most of its profits, given the low ROE, investors may not be benefitting from all that reinvestment after all. The low earnings growth suggests our theory correct. Wrapping up, we would proceed with caution with this company and one way of doing that would be to look at the risk profile of the business. To know the 4 risks we have identified for Simteract visit our risks dashboard for free.
Valuation is complex, but we're helping make it simple.
Find out whether Simteract is potentially over or undervalued by checking out our comprehensive analysis, which includes fair value estimates, risks and warnings, dividends, insider transactions and financial health.
View the Free AnalysisHave feedback on this article? Concerned about the content? Get in touch with us directly. Alternatively, email editorial-team (at) simplywallst.com.
This article by Simply Wall St is general in nature. We provide commentary based on historical data and analyst forecasts only using an unbiased methodology and our articles are not intended to be financial advice. It does not constitute a recommendation to buy or sell any stock, and does not take account of your objectives, or your financial situation. We aim to bring you long-term focused analysis driven by fundamental data. Note that our analysis may not factor in the latest price-sensitive company announcements or qualitative material. Simply Wall St has no position in any stocks mentioned.
Valuation is complex, but we're helping make it simple.
Find out whether Simteract is potentially over or undervalued by checking out our comprehensive analysis, which includes fair value estimates, risks and warnings, dividends, insider transactions and financial health.
View the Free AnalysisHave feedback on this article? Concerned about the content? Get in touch with us directly. Alternatively, email editorial-team@simplywallst.com
About WSE:SMT
Proven track record low.
