- Poland
- /
- Energy Services
- /
- WSE:ZMT
Further weakness as Zamet (WSE:ZMT) drops 28% this week, taking one-year losses to 5.8%


It's easy to match the overall market return by buying an index fund. While individual stocks can be big winners, plenty more fail to generate satisfactory returns. Unfortunately the Zamet S.A. (WSE:ZMT) share price slid 31% over twelve months. That falls noticeably short of the market return of around 27%. On the other hand, the stock is actually up 26% over three years. It's down 36% in about a quarter.
With the stock having lost 28% in the past week, it's worth taking a look at business performance and seeing if there's any red flags.
Check out our latest analysis for Zamet
To paraphrase Benjamin Graham: Over the short term the market is a voting machine, but over the long term it's a weighing machine. One flawed but reasonable way to assess how sentiment around a company has changed is to compare the earnings per share (EPS) with the share price.
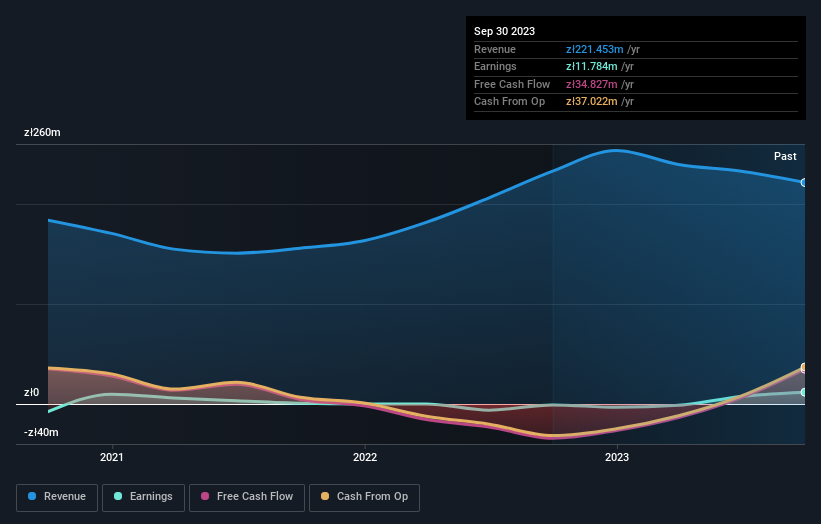
Zamet managed to increase earnings per share from a loss to a profit, over the last 12 months.
Earnings per share growth rates aren't particularly useful for comparing with the share price, when a company has moved from loss to profit. So it makes sense to check out some other factors.
On the other hand, we're certainly perturbed by the 4.9% decline in Zamet's revenue. Many investors see falling revenue as a likely precursor to lower earnings, so this could well explain the weak share price.
The image below shows how earnings and revenue have tracked over time (if you click on the image you can see greater detail).
This free interactive report on Zamet's balance sheet strength is a great place to start, if you want to investigate the stock further.
What About The Total Shareholder Return (TSR)?
We'd be remiss not to mention the difference between Zamet's total shareholder return (TSR) and its share price return. Arguably the TSR is a more complete return calculation because it accounts for the value of dividends (as if they were reinvested), along with the hypothetical value of any discounted capital that have been offered to shareholders. Dividends have been really beneficial for Zamet shareholders, and that cash payout explains why its total shareholder loss of 5.8%, over the last 1 year, isn't as bad as the share price return.
A Different Perspective
While the broader market gained around 27% in the last year, Zamet shareholders lost 5.8%. Even the share prices of good stocks drop sometimes, but we want to see improvements in the fundamental metrics of a business, before getting too interested. Longer term investors wouldn't be so upset, since they would have made 9%, each year, over five years. If the fundamental data continues to indicate long term sustainable growth, the current sell-off could be an opportunity worth considering. It's always interesting to track share price performance over the longer term. But to understand Zamet better, we need to consider many other factors. For example, we've discovered 3 warning signs for Zamet (1 is a bit concerning!) that you should be aware of before investing here.
If you like to buy stocks alongside management, then you might just love this free list of companies. (Hint: many of them are unnoticed AND have attractive valuation).
Please note, the market returns quoted in this article reflect the market weighted average returns of stocks that currently trade on Polish exchanges.
Valuation is complex, but we're here to simplify it.
Discover if Zamet might be undervalued or overvalued with our detailed analysis, featuring fair value estimates, potential risks, dividends, insider trades, and its financial condition.
Access Free AnalysisHave feedback on this article? Concerned about the content? Get in touch with us directly. Alternatively, email editorial-team (at) simplywallst.com.
This article by Simply Wall St is general in nature. We provide commentary based on historical data and analyst forecasts only using an unbiased methodology and our articles are not intended to be financial advice. It does not constitute a recommendation to buy or sell any stock, and does not take account of your objectives, or your financial situation. We aim to bring you long-term focused analysis driven by fundamental data. Note that our analysis may not factor in the latest price-sensitive company announcements or qualitative material. Simply Wall St has no position in any stocks mentioned.
Have feedback on this article? Concerned about the content? Get in touch with us directly. Alternatively, email editorial-team@simplywallst.com
About WSE:ZMT
Zamet
Manufactures and sells industrial steel structures, machinery, and equipment in Poland and internationally.
Excellent balance sheet low.

