

Does the January share price for Lubelski Wegiel Bogdanka S.A. (WSE:LWB) reflect what it's really worth? Today, we will estimate the stock's intrinsic value by taking the expected future cash flows and discounting them to their present value. Our analysis will employ the Discounted Cash Flow (DCF) model. Believe it or not, it's not too difficult to follow, as you'll see from our example!
Remember though, that there are many ways to estimate a company's value, and a DCF is just one method. For those who are keen learners of equity analysis, the Simply Wall St analysis model here may be something of interest to you.
Check out our latest analysis for Lubelski Wegiel Bogdanka
Step by step through the calculation
We're using the 2-stage growth model, which simply means we take in account two stages of company's growth. In the initial period the company may have a higher growth rate and the second stage is usually assumed to have a stable growth rate. To begin with, we have to get estimates of the next ten years of cash flows. Where possible we use analyst estimates, but when these aren't available we extrapolate the previous free cash flow (FCF) from the last estimate or reported value. We assume companies with shrinking free cash flow will slow their rate of shrinkage, and that companies with growing free cash flow will see their growth rate slow, over this period. We do this to reflect that growth tends to slow more in the early years than it does in later years.
A DCF is all about the idea that a dollar in the future is less valuable than a dollar today, so we need to discount the sum of these future cash flows to arrive at a present value estimate:
10-year free cash flow (FCF) estimate
| 2021 | 2022 | 2023 | 2024 | 2025 | 2026 | 2027 | 2028 | 2029 | 2030 | |
| Levered FCF (PLN, Millions) | zł41.3m | zł58.7m | zł52.5m | zł42.9m | zł59.0m | zł58.8m | zł59.2m | zł59.9m | zł60.9m | zł62.1m |
| Growth Rate Estimate Source | Analyst x3 | Analyst x3 | Analyst x2 | Analyst x2 | Analyst x1 | Est @ -0.31% | Est @ 0.61% | Est @ 1.25% | Est @ 1.69% | Est @ 2.01% |
| Present Value (PLN, Millions) Discounted @ 10% | zł37.5 | zł48.2 | zł39.1 | zł29.0 | zł36.2 | zł32.7 | zł29.8 | zł27.4 | zł25.3 | zł23.4 |
("Est" = FCF growth rate estimated by Simply Wall St)
Present Value of 10-year Cash Flow (PVCF) = zł328m
We now need to calculate the Terminal Value, which accounts for all the future cash flows after this ten year period. The Gordon Growth formula is used to calculate Terminal Value at a future annual growth rate equal to the 5-year average of the 10-year government bond yield of 2.7%. We discount the terminal cash flows to today's value at a cost of equity of 10%.
Terminal Value (TV)= FCF2030 × (1 + g) ÷ (r – g) = zł62m× (1 + 2.7%) ÷ (10%– 2.7%) = zł847m
Present Value of Terminal Value (PVTV)= TV / (1 + r)10= zł847m÷ ( 1 + 10%)10= zł318m
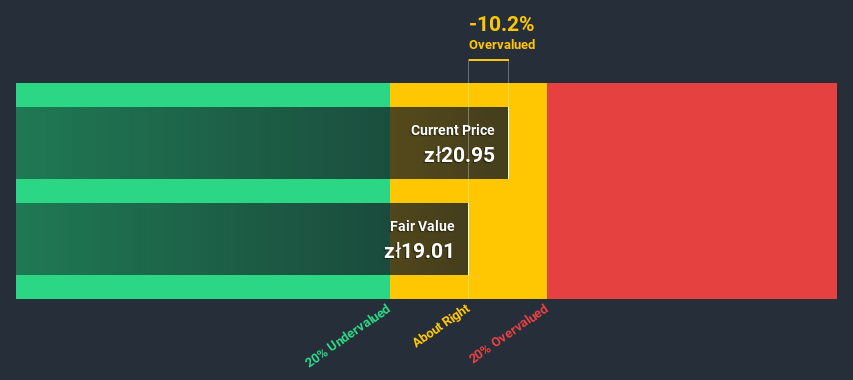
The total value is the sum of cash flows for the next ten years plus the discounted terminal value, which results in the Total Equity Value, which in this case is zł646m. In the final step we divide the equity value by the number of shares outstanding. Compared to the current share price of zł21.0, the company appears around fair value at the time of writing. Remember though, that this is just an approximate valuation, and like any complex formula - garbage in, garbage out.
The assumptions
The calculation above is very dependent on two assumptions. The first is the discount rate and the other is the cash flows. Part of investing is coming up with your own evaluation of a company's future performance, so try the calculation yourself and check your own assumptions. The DCF also does not consider the possible cyclicality of an industry, or a company's future capital requirements, so it does not give a full picture of a company's potential performance. Given that we are looking at Lubelski Wegiel Bogdanka as potential shareholders, the cost of equity is used as the discount rate, rather than the cost of capital (or weighted average cost of capital, WACC) which accounts for debt. In this calculation we've used 10%, which is based on a levered beta of 1.163. Beta is a measure of a stock's volatility, compared to the market as a whole. We get our beta from the industry average beta of globally comparable companies, with an imposed limit between 0.8 and 2.0, which is a reasonable range for a stable business.
Next Steps:
Although the valuation of a company is important, it shouldn't be the only metric you look at when researching a company. It's not possible to obtain a foolproof valuation with a DCF model. Preferably you'd apply different cases and assumptions and see how they would impact the company's valuation. For example, changes in the company's cost of equity or the risk free rate can significantly impact the valuation. For Lubelski Wegiel Bogdanka, we've put together three additional items you should assess:
- Risks: Every company has them, and we've spotted 3 warning signs for Lubelski Wegiel Bogdanka you should know about.
- Future Earnings: How does LWB's growth rate compare to its peers and the wider market? Dig deeper into the analyst consensus number for the upcoming years by interacting with our free analyst growth expectation chart.
- Other High Quality Alternatives: Do you like a good all-rounder? Explore our interactive list of high quality stocks to get an idea of what else is out there you may be missing!
PS. Simply Wall St updates its DCF calculation for every Polish stock every day, so if you want to find the intrinsic value of any other stock just search here.
If you’re looking to trade Lubelski Wegiel Bogdanka, open an account with the lowest-cost* platform trusted by professionals, Interactive Brokers. Their clients from over 200 countries and territories trade stocks, options, futures, forex, bonds and funds worldwide from a single integrated account. Promoted
New: AI Stock Screener & Alerts
Our new AI Stock Screener scans the market every day to uncover opportunities.
• Dividend Powerhouses (3%+ Yield)
• Undervalued Small Caps with Insider Buying
• High growth Tech and AI Companies
Or build your own from over 50 metrics.
This article by Simply Wall St is general in nature. It does not constitute a recommendation to buy or sell any stock, and does not take account of your objectives, or your financial situation. We aim to bring you long-term focused analysis driven by fundamental data. Note that our analysis may not factor in the latest price-sensitive company announcements or qualitative material. Simply Wall St has no position in any stocks mentioned.
*Interactive Brokers Rated Lowest Cost Broker by StockBrokers.com Annual Online Review 2020
Have feedback on this article? Concerned about the content? Get in touch with us directly. Alternatively, email editorial-team (at) simplywallst.com.
About WSE:LWB
Lubelski Wegiel Bogdanka
Engages in the hard coal mining business in Poland.
Flawless balance sheet and good value.

