- Poland
- /
- Construction
- /
- WSE:TOS
Tamex Obiekty Sportowe S.A.'s (WSE:TOS) Stock On An Uptrend: Could Fundamentals Be Driving The Momentum?


Most readers would already be aware that Tamex Obiekty Sportowe's (WSE:TOS) stock increased significantly by 12% over the past week. We wonder if and what role the company's financials play in that price change as a company's long-term fundamentals usually dictate market outcomes. Specifically, we decided to study Tamex Obiekty Sportowe's ROE in this article.
Return on Equity or ROE is a test of how effectively a company is growing its value and managing investors’ money. Put another way, it reveals the company's success at turning shareholder investments into profits.
See our latest analysis for Tamex Obiekty Sportowe
How To Calculate Return On Equity?
Return on equity can be calculated by using the formula:
Return on Equity = Net Profit (from continuing operations) ÷ Shareholders' Equity
So, based on the above formula, the ROE for Tamex Obiekty Sportowe is:
1.0% = zł161k ÷ zł16m (Based on the trailing twelve months to March 2024).
The 'return' is the profit over the last twelve months. One way to conceptualize this is that for each PLN1 of shareholders' capital it has, the company made PLN0.01 in profit.
What Has ROE Got To Do With Earnings Growth?
So far, we've learned that ROE is a measure of a company's profitability. Based on how much of its profits the company chooses to reinvest or "retain", we are then able to evaluate a company's future ability to generate profits. Assuming everything else remains unchanged, the higher the ROE and profit retention, the higher the growth rate of a company compared to companies that don't necessarily bear these characteristics.
A Side By Side comparison of Tamex Obiekty Sportowe's Earnings Growth And 1.0% ROE
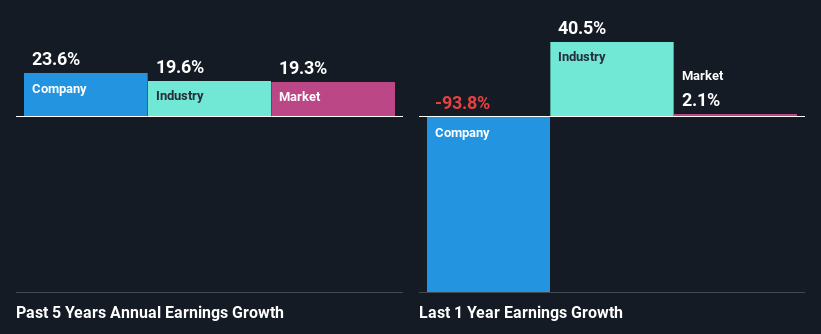
It is hard to argue that Tamex Obiekty Sportowe's ROE is much good in and of itself. Even compared to the average industry ROE of 13%, the company's ROE is quite dismal. In spite of this, Tamex Obiekty Sportowe was able to grow its net income considerably, at a rate of 24% in the last five years. We reckon that there could be other factors at play here. For example, it is possible that the company's management has made some good strategic decisions, or that the company has a low payout ratio.
As a next step, we compared Tamex Obiekty Sportowe's net income growth with the industry, and pleasingly, we found that the growth seen by the company is higher than the average industry growth of 20%.
The basis for attaching value to a company is, to a great extent, tied to its earnings growth. The investor should try to establish if the expected growth or decline in earnings, whichever the case may be, is priced in. By doing so, they will have an idea if the stock is headed into clear blue waters or if swampy waters await. One good indicator of expected earnings growth is the P/E ratio which determines the price the market is willing to pay for a stock based on its earnings prospects. So, you may want to check if Tamex Obiekty Sportowe is trading on a high P/E or a low P/E, relative to its industry.
Is Tamex Obiekty Sportowe Making Efficient Use Of Its Profits?
Given that Tamex Obiekty Sportowe doesn't pay any regular dividends to its shareholders, we infer that the company has been reinvesting all of its profits to grow its business.
Summary
In total, it does look like Tamex Obiekty Sportowe has some positive aspects to its business. Despite its low rate of return, the fact that the company reinvests a very high portion of its profits into its business, no doubt contributed to its high earnings growth. While we won't completely dismiss the company, what we would do, is try to ascertain how risky the business is to make a more informed decision around the company. Our risks dashboard would have the 4 risks we have identified for Tamex Obiekty Sportowe.
Valuation is complex, but we're here to simplify it.
Discover if Tamex Obiekty Sportowe might be undervalued or overvalued with our detailed analysis, featuring fair value estimates, potential risks, dividends, insider trades, and its financial condition.
Access Free AnalysisHave feedback on this article? Concerned about the content? Get in touch with us directly. Alternatively, email editorial-team (at) simplywallst.com.
This article by Simply Wall St is general in nature. We provide commentary based on historical data and analyst forecasts only using an unbiased methodology and our articles are not intended to be financial advice. It does not constitute a recommendation to buy or sell any stock, and does not take account of your objectives, or your financial situation. We aim to bring you long-term focused analysis driven by fundamental data. Note that our analysis may not factor in the latest price-sensitive company announcements or qualitative material. Simply Wall St has no position in any stocks mentioned.
About WSE:TOS
Adequate balance sheet slight.

