
Advertisement
There are a few key trends to look for if we want to identify the next multi-bagger. Amongst other things, we'll want to see two things; firstly, a growing return on capital employed (ROCE) and secondly, an expansion in the company's amount of capital employed. If you see this, it typically means it's a company with a great business model and plenty of profitable reinvestment opportunities. That's why when we briefly looked at EBOS Group's (NZSE:EBO) ROCE trend, we were pretty happy with what we saw.
Return On Capital Employed (ROCE): What Is It?
If you haven't worked with ROCE before, it measures the 'return' (pre-tax profit) a company generates from capital employed in its business. To calculate this metric for EBOS Group, this is the formula:
Return on Capital Employed = Earnings Before Interest and Tax (EBIT) ÷ (Total Assets - Current Liabilities)
0.12 = AU$445m ÷ (AU$6.4b - AU$2.7b) (Based on the trailing twelve months to June 2023).
Therefore, EBOS Group has an ROCE of 12%. On its own, that's a standard return, however it's much better than the 0.5% generated by the Healthcare industry.
Check out our latest analysis for EBOS Group
In the above chart we have measured EBOS Group's prior ROCE against its prior performance, but the future is arguably more important. If you'd like, you can check out the forecasts from the analysts covering EBOS Group here for free.
So How Is EBOS Group's ROCE Trending?
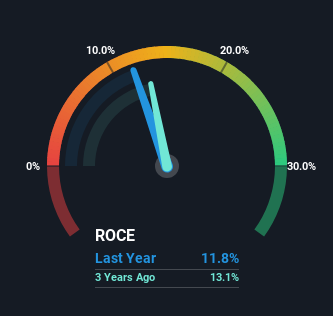
The trend of ROCE doesn't stand out much, but returns on a whole are decent. The company has employed 139% more capital in the last five years, and the returns on that capital have remained stable at 12%. 12% is a pretty standard return, and it provides some comfort knowing that EBOS Group has consistently earned this amount. Over long periods of time, returns like these might not be too exciting, but with consistency they can pay off in terms of share price returns.
On a separate but related note, it's important to know that EBOS Group has a current liabilities to total assets ratio of 41%, which we'd consider pretty high. This can bring about some risks because the company is basically operating with a rather large reliance on its suppliers or other sorts of short-term creditors. Ideally we'd like to see this reduce as that would mean fewer obligations bearing risks.
In Conclusion...
The main thing to remember is that EBOS Group has proven its ability to continually reinvest at respectable rates of return. And the stock has followed suit returning a meaningful 95% to shareholders over the last five years. So while the positive underlying trends may be accounted for by investors, we still think this stock is worth looking into further.
If you're still interested in EBOS Group it's worth checking out our FREE intrinsic value approximation to see if it's trading at an attractive price in other respects.
If you want to search for solid companies with great earnings, check out this free list of companies with good balance sheets and impressive returns on equity.
Valuation is complex, but we're here to simplify it.
Discover if EBOS Group might be undervalued or overvalued with our detailed analysis, featuring fair value estimates, potential risks, dividends, insider trades, and its financial condition.
Access Free AnalysisHave feedback on this article? Concerned about the content? Get in touch with us directly. Alternatively, email editorial-team (at) simplywallst.com.
This article by Simply Wall St is general in nature. We provide commentary based on historical data and analyst forecasts only using an unbiased methodology and our articles are not intended to be financial advice. It does not constitute a recommendation to buy or sell any stock, and does not take account of your objectives, or your financial situation. We aim to bring you long-term focused analysis driven by fundamental data. Note that our analysis may not factor in the latest price-sensitive company announcements or qualitative material. Simply Wall St has no position in any stocks mentioned.
About NZSE:EBO
EBOS Group
Engages in the marketing, wholesale, and distribution of healthcare, medical, pharmaceutical, and animal care products in Australia, Southeast Asia, and New Zealand.
Flawless balance sheet, good value and pays a dividend.
Market Insights

Advertisement
Community Narratives
MicroVision will explode future revenue by 380.37% with a vision towards success
Fair Value US$60.00|98.5% undervalued
TH
Community Contributor
The Indispensable Artery for a New North American Economy
Fair Value CA$132.87|2.3% undervalued
TI
Community Contributor