Stock Analysis
- New Zealand
- /
- Banks
- /
- NZSE:HGH
Heartland Group Holdings' (NZSE:HGH one-year decrease in earnings delivers investors with a 11% loss


It's easy to match the overall market return by buying an index fund. When you buy individual stocks, you can make higher profits, but you also face the risk of under-performance. That downside risk was realized by Heartland Group Holdings Limited (NZSE:HGH) shareholders over the last year, as the share price declined 18%. That contrasts poorly with the market decline of 2.7%. At least the damage isn't so bad if you look at the last three years, since the stock is down 11% in that time. Furthermore, it's down 15% in about a quarter. That's not much fun for holders.
After losing 7.5% this past week, it's worth investigating the company's fundamentals to see what we can infer from past performance.
See our latest analysis for Heartland Group Holdings
There is no denying that markets are sometimes efficient, but prices do not always reflect underlying business performance. By comparing earnings per share (EPS) and share price changes over time, we can get a feel for how investor attitudes to a company have morphed over time.
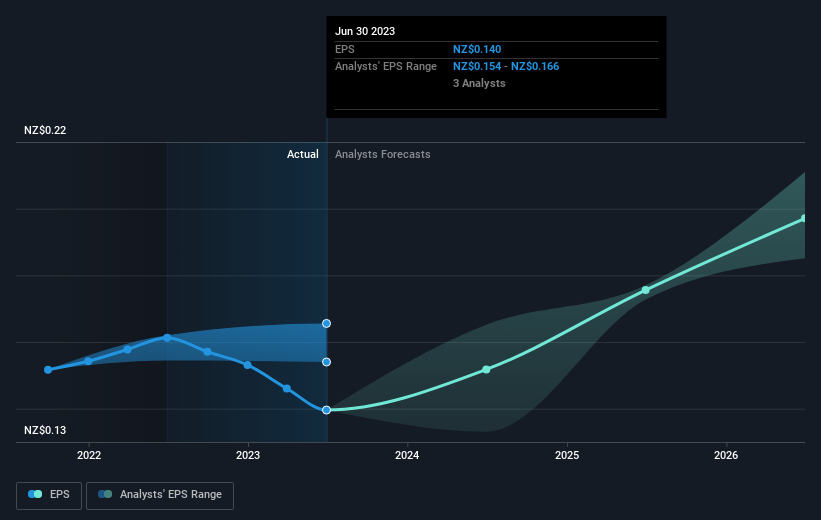
Unfortunately Heartland Group Holdings reported an EPS drop of 13% for the last year. This reduction in EPS is not as bad as the 18% share price fall. Unsurprisingly, given the lack of EPS growth, the market seems to be more cautious about the stock. The P/E ratio of 11.04 also points to the negative market sentiment.
You can see how EPS has changed over time in the image below (click on the chart to see the exact values).
Dive deeper into Heartland Group Holdings' key metrics by checking this interactive graph of Heartland Group Holdings's earnings, revenue and cash flow.
What About Dividends?
When looking at investment returns, it is important to consider the difference between total shareholder return (TSR) and share price return. The TSR is a return calculation that accounts for the value of cash dividends (assuming that any dividend received was reinvested) and the calculated value of any discounted capital raisings and spin-offs. It's fair to say that the TSR gives a more complete picture for stocks that pay a dividend. In the case of Heartland Group Holdings, it has a TSR of -11% for the last 1 year. That exceeds its share price return that we previously mentioned. And there's no prize for guessing that the dividend payments largely explain the divergence!
A Different Perspective
Heartland Group Holdings shareholders are down 11% for the year (even including dividends), but the market itself is up 2.7%. Even the share prices of good stocks drop sometimes, but we want to see improvements in the fundamental metrics of a business, before getting too interested. Longer term investors wouldn't be so upset, since they would have made 9%, each year, over five years. If the fundamental data continues to indicate long term sustainable growth, the current sell-off could be an opportunity worth considering. It's always interesting to track share price performance over the longer term. But to understand Heartland Group Holdings better, we need to consider many other factors. Case in point: We've spotted 1 warning sign for Heartland Group Holdings you should be aware of.
If you are like me, then you will not want to miss this free list of growing companies that insiders are buying.
Please note, the market returns quoted in this article reflect the market weighted average returns of stocks that currently trade on New Zealander exchanges.
Valuation is complex, but we're helping make it simple.
Find out whether Heartland Group Holdings is potentially over or undervalued by checking out our comprehensive analysis, which includes fair value estimates, risks and warnings, dividends, insider transactions and financial health.
View the Free AnalysisHave feedback on this article? Concerned about the content? Get in touch with us directly. Alternatively, email editorial-team (at) simplywallst.com.
This article by Simply Wall St is general in nature. We provide commentary based on historical data and analyst forecasts only using an unbiased methodology and our articles are not intended to be financial advice. It does not constitute a recommendation to buy or sell any stock, and does not take account of your objectives, or your financial situation. We aim to bring you long-term focused analysis driven by fundamental data. Note that our analysis may not factor in the latest price-sensitive company announcements or qualitative material. Simply Wall St has no position in any stocks mentioned.
About NZSE:HGH
Heartland Group Holdings
Provides various financial services in New Zealand and Australia.
Established dividend payer with mediocre balance sheet.
