- Norway
- /
- Marine and Shipping
- /
- OB:SNI
Stolt-Nielsen (OB:SNI) shareholders have earned a 45% CAGR over the last five years


Long term investing can be life changing when you buy and hold the truly great businesses. While not every stock performs well, when investors win, they can win big. Don't believe it? Then look at the Stolt-Nielsen Limited (OB:SNI) share price. It's 386% higher than it was five years ago. If that doesn't get you thinking about long term investing, we don't know what will. Also pleasing for shareholders was the 28% gain in the last three months.
So let's investigate and see if the longer term performance of the company has been in line with the underlying business' progress.
Check out our latest analysis for Stolt-Nielsen
To quote Buffett, 'Ships will sail around the world but the Flat Earth Society will flourish. There will continue to be wide discrepancies between price and value in the marketplace...' By comparing earnings per share (EPS) and share price changes over time, we can get a feel for how investor attitudes to a company have morphed over time.
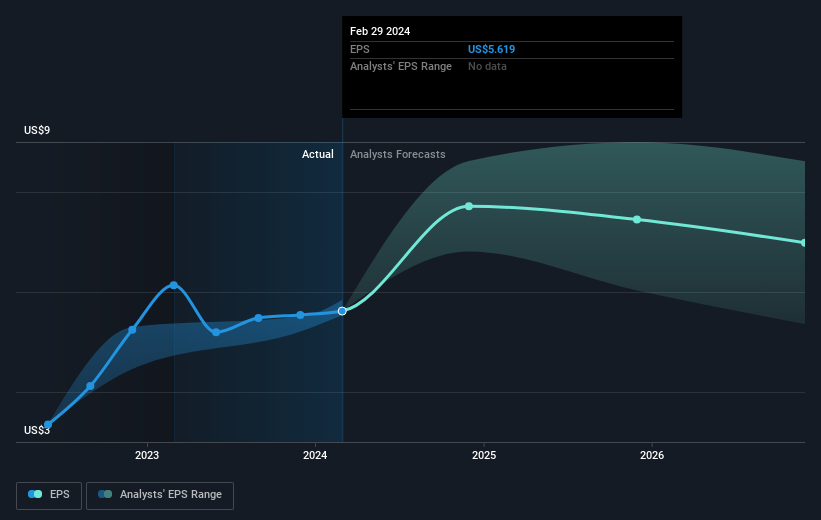
Over half a decade, Stolt-Nielsen managed to grow its earnings per share at 65% a year. This EPS growth is higher than the 37% average annual increase in the share price. Therefore, it seems the market has become relatively pessimistic about the company. This cautious sentiment is reflected in its (fairly low) P/E ratio of 8.37.
You can see how EPS has changed over time in the image below (click on the chart to see the exact values).
We like that insiders have been buying shares in the last twelve months. Having said that, most people consider earnings and revenue growth trends to be a more meaningful guide to the business. Before buying or selling a stock, we always recommend a close examination of historic growth trends, available here..
What About Dividends?
It is important to consider the total shareholder return, as well as the share price return, for any given stock. The TSR incorporates the value of any spin-offs or discounted capital raisings, along with any dividends, based on the assumption that the dividends are reinvested. It's fair to say that the TSR gives a more complete picture for stocks that pay a dividend. In the case of Stolt-Nielsen, it has a TSR of 536% for the last 5 years. That exceeds its share price return that we previously mentioned. And there's no prize for guessing that the dividend payments largely explain the divergence!
A Different Perspective
It's good to see that Stolt-Nielsen has rewarded shareholders with a total shareholder return of 83% in the last twelve months. That's including the dividend. Since the one-year TSR is better than the five-year TSR (the latter coming in at 45% per year), it would seem that the stock's performance has improved in recent times. Someone with an optimistic perspective could view the recent improvement in TSR as indicating that the business itself is getting better with time. It's always interesting to track share price performance over the longer term. But to understand Stolt-Nielsen better, we need to consider many other factors. Consider risks, for instance. Every company has them, and we've spotted 3 warning signs for Stolt-Nielsen you should know about.
Stolt-Nielsen is not the only stock insiders are buying. So take a peek at this free list of small cap companies at attractive valuations which insiders have been buying.
Please note, the market returns quoted in this article reflect the market weighted average returns of stocks that currently trade on Norwegian exchanges.
New: Manage All Your Stock Portfolios in One Place
We've created the ultimate portfolio companion for stock investors, and it's free.
• Connect an unlimited number of Portfolios and see your total in one currency
• Be alerted to new Warning Signs or Risks via email or mobile
• Track the Fair Value of your stocks
Have feedback on this article? Concerned about the content? Get in touch with us directly. Alternatively, email editorial-team (at) simplywallst.com.
This article by Simply Wall St is general in nature. We provide commentary based on historical data and analyst forecasts only using an unbiased methodology and our articles are not intended to be financial advice. It does not constitute a recommendation to buy or sell any stock, and does not take account of your objectives, or your financial situation. We aim to bring you long-term focused analysis driven by fundamental data. Note that our analysis may not factor in the latest price-sensitive company announcements or qualitative material. Simply Wall St has no position in any stocks mentioned.
About OB:SNI
Stolt-Nielsen
Provides transportation, storage, and distribution solutions for bulk liquid chemicals, edible oils, acids, and other specialty liquids worldwide.
Undervalued with proven track record and pays a dividend.

