- Norway
- /
- Marine and Shipping
- /
- OB:MPCC
Despite the downward trend in earnings at MPC Container Ships (OB:MPCC) the stock rises 6.1%, bringing one-year gains to 77%


The simplest way to invest in stocks is to buy exchange traded funds. But if you pick the right individual stocks, you could make more than that. For example, the MPC Container Ships ASA (OB:MPCC) share price is up 21% in the last 1 year, clearly besting the market return of around 8.4% (not including dividends). So that should have shareholders smiling. In contrast, the longer term returns are negative, since the share price is 8.9% lower than it was three years ago.
Since it's been a strong week for MPC Container Ships shareholders, let's have a look at trend of the longer term fundamentals.
View our latest analysis for MPC Container Ships
To quote Buffett, 'Ships will sail around the world but the Flat Earth Society will flourish. There will continue to be wide discrepancies between price and value in the marketplace...' One way to examine how market sentiment has changed over time is to look at the interaction between a company's share price and its earnings per share (EPS).
During the last year, MPC Container Ships actually saw its earnings per share drop 36%.
This means it's unlikely the market is judging the company based on earnings growth. Since the change in EPS doesn't seem to correlate with the change in share price, it's worth taking a look at other metrics.
Absent any improvement, we don't think a thirst for dividends is pushing up the MPC Container Ships' share price. Rather, we'd posit that the revenue increase of 3.8% might be more meaningful. After all, it's not necessarily a bad thing if a business sacrifices profits today in pursuit of profit tomorrow (metaphorically speaking).
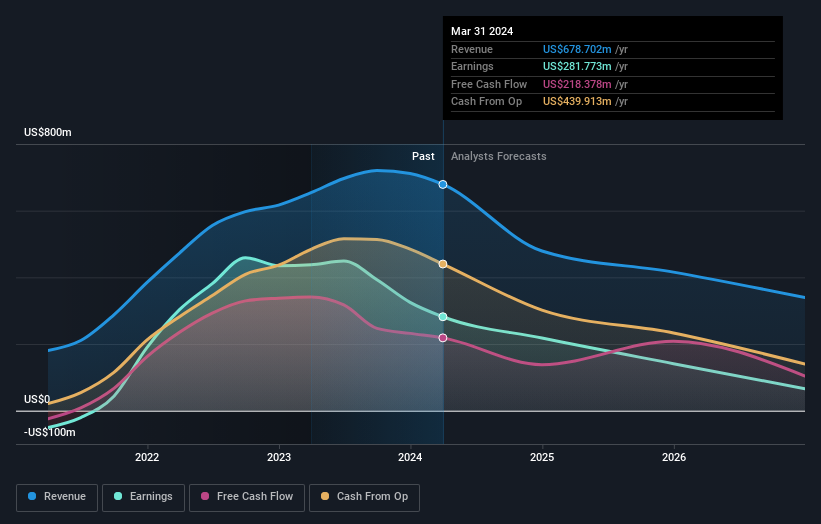
The company's revenue and earnings (over time) are depicted in the image below (click to see the exact numbers).
We know that MPC Container Ships has improved its bottom line over the last three years, but what does the future have in store? You can see how its balance sheet has strengthened (or weakened) over time in this free interactive graphic.
What About Dividends?
It is important to consider the total shareholder return, as well as the share price return, for any given stock. The TSR is a return calculation that accounts for the value of cash dividends (assuming that any dividend received was reinvested) and the calculated value of any discounted capital raisings and spin-offs. So for companies that pay a generous dividend, the TSR is often a lot higher than the share price return. As it happens, MPC Container Ships' TSR for the last 1 year was 77%, which exceeds the share price return mentioned earlier. The dividends paid by the company have thusly boosted the total shareholder return.
A Different Perspective
It's good to see that MPC Container Ships has rewarded shareholders with a total shareholder return of 77% in the last twelve months. Of course, that includes the dividend. That's better than the annualised return of 39% over half a decade, implying that the company is doing better recently. In the best case scenario, this may hint at some real business momentum, implying that now could be a great time to delve deeper. I find it very interesting to look at share price over the long term as a proxy for business performance. But to truly gain insight, we need to consider other information, too. Take risks, for example - MPC Container Ships has 4 warning signs (and 1 which is a bit concerning) we think you should know about.
If you are like me, then you will not want to miss this free list of undervalued small caps that insiders are buying.
Please note, the market returns quoted in this article reflect the market weighted average returns of stocks that currently trade on Norwegian exchanges.
New: Manage All Your Stock Portfolios in One Place
We've created the ultimate portfolio companion for stock investors, and it's free.
• Connect an unlimited number of Portfolios and see your total in one currency
• Be alerted to new Warning Signs or Risks via email or mobile
• Track the Fair Value of your stocks
Have feedback on this article? Concerned about the content? Get in touch with us directly. Alternatively, email editorial-team (at) simplywallst.com.
This article by Simply Wall St is general in nature. We provide commentary based on historical data and analyst forecasts only using an unbiased methodology and our articles are not intended to be financial advice. It does not constitute a recommendation to buy or sell any stock, and does not take account of your objectives, or your financial situation. We aim to bring you long-term focused analysis driven by fundamental data. Note that our analysis may not factor in the latest price-sensitive company announcements or qualitative material. Simply Wall St has no position in any stocks mentioned.
Have feedback on this article? Concerned about the content? Get in touch with us directly. Alternatively, email editorial-team@simplywallst.com
About OB:MPCC
Flawless balance sheet and fair value.
