
Advertisement
- Norway
- /
- Marine and Shipping
- /
- OB:HAUTO
Höegh Autoliners ASA (OB:HAUTO) Shares Could Be 48% Below Their Intrinsic Value Estimate
Key Insights
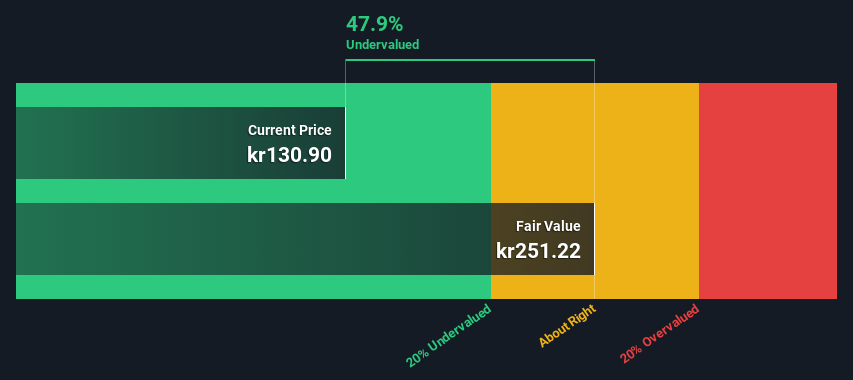
- The projected fair value for Höegh Autoliners is kr251 based on 2 Stage Free Cash Flow to Equity
- Höegh Autoliners' kr131 share price signals that it might be 48% undervalued
- Our fair value estimate is 63% higher than Höegh Autoliners' analyst price target of kr154
How far off is Höegh Autoliners ASA ( OB:HAUTO ) from its intrinsic value? Using the most recent financial data, we'll take a look at whether the stock is fairly priced by projecting its future cash flows and then discounting them to today's value. This will be done using the Discounted Cash Flow (DCF) model. Don't get put off by the jargon, the math behind it is actually quite straightforward.
We would caution that there are many ways of valuing a company and, like the DCF, each technique has advantages and disadvantages in certain scenarios. If you want to learn more about discounted cash flow, the rationale behind this calculation can be read in detail in the Simply Wall St analysis model .
View our latest analysis for Höegh Autoliners
What's The Estimated Valuation?
We're using the 2-stage growth model, which simply means we take in account two stages of company's growth. In the initial period the company may have a higher growth rate and the second stage is usually assumed to have a stable growth rate. To start off with, we need to estimate the next ten years of cash flows. Where possible we use analyst estimates, but when these aren't available we extrapolate the previous free cash flow (FCF) from the last estimate or reported value. We assume companies with shrinking free cash flow will slow their rate of shrinkage, and that companies with growing free cash flow will see their growth rate slow, over this period. We do this to reflect that growth tends to slow more in the early years than it does in later years.
Generally we assume that a dollar today is more valuable than a dollar in the future, so we need to discount the sum of these future cash flows to arrive at a present value estimate:
10-year free cash flow (FCF) estimate
| 2025 | 2026 | 2027 | 2028 | 2029 | 2030 | 2031 | 2032 | 2033 | 2034 | |
| Levered FCF ($, Millions) | US$403.0m | US$297.5m | US$250.8m | US$224.9m | US$210.2m | US$202.0m | US$197.9m | US$196.3m | US$196.6m | US$198.1m |
| Growth Rate Estimate Source | Analyst x3 | Analyst x2 | Est @ -15.69% | Est @ -10.31% | Est @ -6.54% | Est @ -3.90% | Est @ -2.06% | Est @ -0.77% | Est @ 0.14% | Est @ 0.77% |
| Present Value ($, Millions) Discounted @ 6.4% | US$379 | US$263 | US$209 | US$176 | US$155 | US$140 | US$129 | US$120 | US$113 | US$107 |
("Est" = FCF growth rate estimated by Simply Wall St)
Present Value of 10-year Cash Flow (PVCF) = US$1.8b
We now need to calculate the Terminal Value, which accounts for all the future cash flows after this ten year period. For a number of reasons a very conservative growth rate is used that cannot exceed that of a country's GDP growth. In this case we have used the 5-year average of the 10-year government bond yield (2.3%) to estimate future growth. In the same way as with the 10-year 'growth' period, we discount future cash flows to today's value, using a cost of equity of 6.4%.
Terminal Value (TV) = FCF 2034 × (1 + g) ÷ (r – g) = US$198m× (1 + 2.3%) ÷ (6.4%– 2.3%) = US$4.9b
Present Value of Terminal Value (PVTV) = TV / (1 + r) 10 = US$4.9b÷ ( 1 + 6.4%) 10 = US$2.7b
The total value is the sum of cash flows for the next ten years plus the discounted terminal value, which results in the Total Equity Value, which in this case is US$4.5b. To get the intrinsic value per share, we divide this by the total number of shares outstanding. Compared to the current share price of kr131, the company appears quite good value at a 48% discount to where the stock price trades currently. The assumptions in any calculation have a big impact on the valuation, so it is better to view this as a rough estimate, not precise down to the last cent.
Important Assumptions
Now the most important inputs to a discounted cash flow are the discount rate, and of course, the actual cash flows. If you don't agree with these result, have a go at the calculation yourself and play with the assumptions. The DCF also does not consider the possible cyclicality of an industry, or a company's future capital requirements, so it does not give a full picture of a company's potential performance. Given that we are looking at Höegh Autoliners as potential shareholders, the cost of equity is used as the discount rate, rather than the cost of capital (or weighted average cost of capital, WACC) which accounts for debt. In this calculation we've used 6.4%, which is based on a levered beta of 0.995. Beta is a measure of a stock's volatility, compared to the market as a whole. We get our beta from the industry average beta of globally comparable companies, with an imposed limit between 0.8 and 2.0, which is a reasonable range for a stable business.
SWOT Analysis for Höegh Autoliners
Strength
- Earnings growth over the past year exceeded the industry.
- Debt is not viewed as a risk.
- Dividend is in the top 25% of dividend payers in the market.
Weakness
- Earnings growth over the past year is below its 5-year average.
Opportunity
- Good value based on P/E ratio and estimated fair value.
Threat
- Dividends are not covered by cash flow.
- Annual earnings are forecast to decline for the next 3 years.
Looking Ahead:
Whilst important, the DCF calculation shouldn't be the only metric you look at when researching a company. DCF models are not the be-all and end-all of investment valuation. Rather it should be seen as a guide to "what assumptions need to be true for this stock to be under/overvalued?" For instance, if the terminal value growth rate is adjusted slightly, it can dramatically alter the overall result. What is the reason for the share price sitting below the intrinsic value? For Höegh Autoliners, there are three pertinent factors you should explore:
- Risks : To that end, you should learn about the 2 warning signs we've spotted with Höegh Autoliners (including 1 which is significant) .
- Future Earnings : How does HAUTO's growth rate compare to its peers and the wider market? Dig deeper into the analyst consensus number for the upcoming years by interacting with our free analyst growth expectation chart .
- Other High Quality Alternatives : Do you like a good all-rounder? Explore our interactive list of high quality stocks to get an idea of what else is out there you may be missing!
PS. The Simply Wall St app conducts a discounted cash flow valuation for every stock on the OB every day. If you want to find the calculation for other stocks just search here .
Valuation is complex, but we're here to simplify it.
Discover if Höegh Autoliners might be undervalued or overvalued with our detailed analysis, featuring fair value estimates, potential risks, dividends, insider trades, and its financial condition.
Access Free AnalysisHave feedback on this article? Concerned about the content? Get in touch with us directly. Alternatively, email editorial-team (at) simplywallst.com.
This article by Simply Wall St is general in nature. We provide commentary based on historical data and analyst forecasts only using an unbiased methodology and our articles are not intended to be financial advice. It does not constitute a recommendation to buy or sell any stock, and does not take account of your objectives, or your financial situation. We aim to bring you long-term focused analysis driven by fundamental data. Note that our analysis may not factor in the latest price-sensitive company announcements or qualitative material. Simply Wall St has no position in any stocks mentioned.
About OB:HAUTO
Höegh Autoliners
Provides ocean transportation services within the roll-on roll-off (RoRo) cargoes on deep sea and short sea markets in Norway.
Good value with adequate balance sheet.
Market Insights

Advertisement
Community Narratives
MicroVision will explode future revenue by 380.37% with a vision towards success
Fair Value US$60.00|98.3% undervalued
TH
Community Contributor
The Indispensable Artery for a New North American Economy
Fair Value CA$132.87|1.0% undervalued
TI
Community Contributor