
Advertisement
StrongPoint ASA's (OB:STRO) Dismal Stock Performance Reflects Weak Fundamentals
StrongPoint (OB:STRO) has had a rough three months with its share price down 17%. We decided to study the company's financials to determine if the downtrend will continue as the long-term performance of a company usually dictates market outcomes. In this article, we decided to focus on StrongPoint's ROE.
Return on Equity or ROE is a test of how effectively a company is growing its value and managing investors’ money. Simply put, it is used to assess the profitability of a company in relation to its equity capital.
Check out our latest analysis for StrongPoint
How Do You Calculate Return On Equity?
ROE can be calculated by using the formula:
Return on Equity = Net Profit (from continuing operations) ÷ Shareholders' Equity
So, based on the above formula, the ROE for StrongPoint is:
1.5% = kr7.5m ÷ kr491m (Based on the trailing twelve months to September 2023).
The 'return' refers to a company's earnings over the last year. Another way to think of that is that for every NOK1 worth of equity, the company was able to earn NOK0.02 in profit.
What Has ROE Got To Do With Earnings Growth?
Thus far, we have learned that ROE measures how efficiently a company is generating its profits. Depending on how much of these profits the company reinvests or "retains", and how effectively it does so, we are then able to assess a company’s earnings growth potential. Assuming all else is equal, companies that have both a higher return on equity and higher profit retention are usually the ones that have a higher growth rate when compared to companies that don't have the same features.
StrongPoint's Earnings Growth And 1.5% ROE
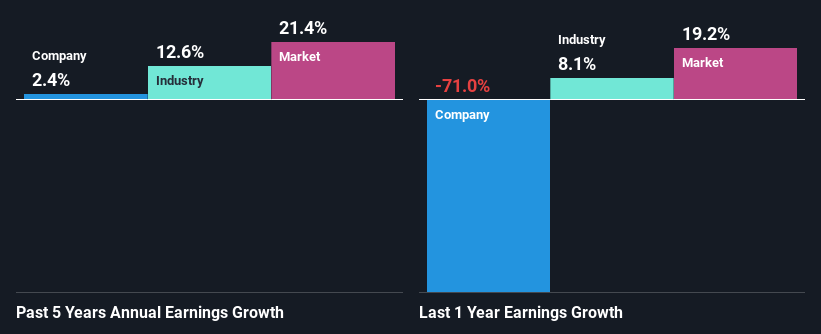
It is hard to argue that StrongPoint's ROE is much good in and of itself. Even compared to the average industry ROE of 13%, the company's ROE is quite dismal. Accordingly, StrongPoint's low net income growth of 2.4% over the past five years can possibly be explained by the low ROE amongst other factors.
Next, on comparing with the industry net income growth, we found that StrongPoint's reported growth was lower than the industry growth of 13% over the last few years, which is not something we like to see.
Earnings growth is an important metric to consider when valuing a stock. What investors need to determine next is if the expected earnings growth, or the lack of it, is already built into the share price. Doing so will help them establish if the stock's future looks promising or ominous. Is StrongPoint fairly valued compared to other companies? These 3 valuation measures might help you decide.
Is StrongPoint Using Its Retained Earnings Effectively?
StrongPoint's very high three-year median payout ratio of 137% suggests that the company is paying its shareholders more than what it is earning and it definitely contributes to the low earnings growth seen by the company. That's a huge risk in our books. Our risks dashboard should have the 3 risks we have identified for StrongPoint.
In addition, StrongPoint has been paying dividends over a period of at least ten years suggesting that keeping up dividend payments is way more important to the management even if it comes at the cost of business growth. Our latest analyst data shows that the future payout ratio of the company is expected to drop to 43% over the next three years. The fact that the company's ROE is expected to rise to 22% over the same period is explained by the drop in the payout ratio.
Summary
Overall, we would be extremely cautious before making any decision on StrongPoint. Particularly, its ROE is a huge disappointment, not to mention its lack of proper reinvestment into the business. As a result its earnings growth has also been quite disappointing. That being so, the latest analyst forecasts show that the company will continue to see an expansion in its earnings. To know more about the company's future earnings growth forecasts take a look at this free report on analyst forecasts for the company to find out more.
New: Manage All Your Stock Portfolios in One Place
We've created the ultimate portfolio companion for stock investors, and it's free.
• Connect an unlimited number of Portfolios and see your total in one currency
• Be alerted to new Warning Signs or Risks via email or mobile
• Track the Fair Value of your stocks
Have feedback on this article? Concerned about the content? Get in touch with us directly. Alternatively, email editorial-team (at) simplywallst.com.
This article by Simply Wall St is general in nature. We provide commentary based on historical data and analyst forecasts only using an unbiased methodology and our articles are not intended to be financial advice. It does not constitute a recommendation to buy or sell any stock, and does not take account of your objectives, or your financial situation. We aim to bring you long-term focused analysis driven by fundamental data. Note that our analysis may not factor in the latest price-sensitive company announcements or qualitative material. Simply Wall St has no position in any stocks mentioned.
About OB:STRO
StrongPoint
Engages in the development, sale, and implementation of integrated technology solutions to retailers in Scandinavia and internationally.
Reasonable growth potential with adequate balance sheet.
Market Insights

Advertisement
Weekly Picks
FA

FAI on Arabian Internet and Communication Services ·
Solutions by stc: 34% Upside in Saudi's Digital Transformation Leader
Fair Value:ر.س342.2335.3% undervalued
9 followersusers have followed this narrative
1 commentusers have commented on this narrative
3 likesusers have liked this narrative
RO


RobertoAllende on NVIDIA ·
The AI Infrastructure Giant Grows Into Its Valuation
Fair Value:US$345.0747.9% undervalued
27 followersusers have followed this narrative
28 commentsusers have commented on this narrative
21 likesusers have liked this narrative
Recently Updated Narratives
HA

Haha94 on Perdana Petroleum Berhad ·
Perdana Petroleum Berhad is a Zombie Business with a 27.34% Profit Margin and inflation adjusted revenue Business
Fair Value:RM 0.2128.6% undervalued
1 followerusers have followed this narrative
0 commentsusers have commented on this narrative
0 likesusers have liked this narrative
AB
Abc on Global X Etfs Icav - Global X Silver Miners Ucits ETF ·
Many trends acting at the same time
Fair Value:€10068.5% undervalued
1 followerusers have followed this narrative
0 commentsusers have commented on this narrative
0 likesusers have liked this narrative
NI


niteco on Texas Instruments ·
Engineered for Stability. Positioned for Growth.
Fair Value:US$314.4446.5% undervalued
2 followersusers have followed this narrative
0 commentsusers have commented on this narrative
0 likesusers have liked this narrative
Popular Narratives
TH

TheWallstreetKing on MicroVision ·
MicroVision will explode future revenue by 380.37% with a vision towards success
Fair Value:US$6098.6% undervalued
109 followersusers have followed this narrative
11 commentsusers have commented on this narrative
22 likesusers have liked this narrative
AN

AnalystConsensusTarget on NVIDIA ·
NVDA: Expanding AI Demand Will Drive Major Data Center Investments Through 2026
Fair Value:US$250.3928.1% undervalued
941 followersusers have followed this narrative
6 commentsusers have commented on this narrative
24 likesusers have liked this narrative
OS


oscargarcia on Alphabet ·
The company that turned a verb into a global necessity and basically runs the modern internet, digital ads, smartphones, maps, and AI.
Fair Value:US$3407.4% undervalued
145 followersusers have followed this narrative
6 commentsusers have commented on this narrative
18 likesusers have liked this narrative