Advertisement
3 European Stocks That May Be Trading Below Intrinsic Value By Up To 26.7%

Simply Wall St
Reviewed by Simply Wall St
Amidst renewed concerns over inflated AI stock valuations, the European markets have experienced a downturn, with the pan-European STOXX Europe 600 Index falling by 2.21%. As investors navigate these turbulent times, identifying stocks that may be trading below their intrinsic value can offer potential opportunities for those looking to capitalize on market inefficiencies.
Top 10 Undervalued Stocks Based On Cash Flows In Europe
| Name | Current Price | Fair Value (Est) | Discount (Est) |
| Vimi Fasteners (BIT:VIM) | €1.07 | €2.12 | 49.4% |
| Talgo (BME:TLGO) | €2.705 | €5.35 | 49.4% |
| STEICO (XTRA:ST5) | €20.10 | €40.10 | 49.9% |
| Roche Bobois (ENXTPA:RBO) | €34.80 | €69.37 | 49.8% |
| Micro Systemation (OM:MSAB B) | SEK64.60 | SEK127.66 | 49.4% |
| HMS Bergbau (XTRA:HMU) | €52.00 | €103.88 | 49.9% |
| Exel Composites Oyj (HLSE:EXL1V) | €0.392 | €0.78 | 49.9% |
| EcoUp Oyj (HLSE:ECOUP) | €1.32 | €2.64 | 50% |
| Delivery Hero (XTRA:DHER) | €16.02 | €31.79 | 49.6% |
| Daldrup & Söhne (XTRA:4DS) | €16.05 | €31.48 | 49% |
We'll examine a selection from our screener results.
cBrain (CPSE:CBRAIN)
Overview: cBrain A/S is a software company that offers solutions for government, private, education, and non-profit sectors across Denmark, the European Union, and internationally, with a market cap of DKK2.72 billion.
Operations: The company's revenue is primarily derived from its Software & Programming segment, totaling DKK260.91 million.
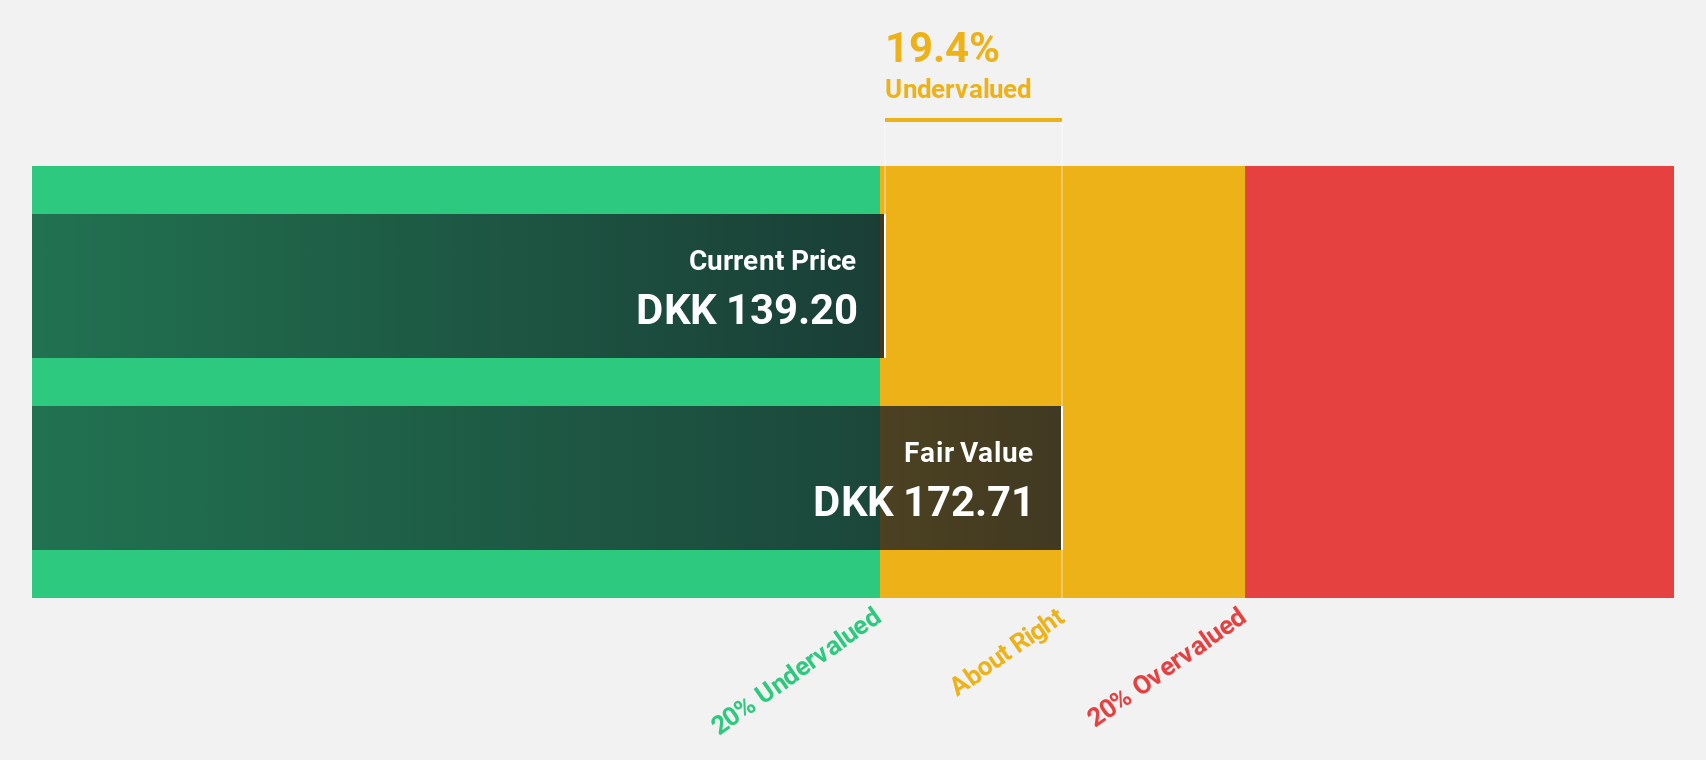
Estimated Discount To Fair Value: 19.4%
cBrain is trading at DKK139.2, approximately 19.4% below its estimated fair value of DKK172.71, indicating it may be undervalued based on cash flows. Despite recent guidance lowering full-year revenue growth to 0%-5%, earnings are forecast to grow significantly at 31.98% annually over the next three years, outpacing the Danish market's growth rate of 5%. The company's Return on Equity is expected to reach a high level of 24.6%.
- According our earnings growth report, there's an indication that cBrain might be ready to expand.
- Unlock comprehensive insights into our analysis of cBrain stock in this financial health report.
Norbit (OB:NORBT)
Overview: Norbit ASA offers technology solutions across various industries and has a market cap of NOK11.32 billion.
Operations: The company's revenue segments consist of Oceans at NOK933.50 million, Connectivity at NOK575.90 million, and Product Innovation and Realization (PIR) at NOK826.90 million.
Estimated Discount To Fair Value: 13%
Norbit is trading at NOK177.4, about 13% below its estimated fair value of NOK203.9, suggesting potential undervaluation based on cash flows. Recent earnings reports show a strong performance with net income doubling year-over-year to NOK 272.8 million for the first nine months of 2025. The company's earnings are forecast to grow significantly by 21.9% annually over the next three years, surpassing Norwegian market expectations, while maintaining a very high projected Return on Equity of 40.3%.
- The growth report we've compiled suggests that Norbit's future prospects could be on the up.
- Get an in-depth perspective on Norbit's balance sheet by reading our health report here.
Troax Group (OM:TROAX)
Overview: Troax Group AB (publ) specializes in the production and sale of mesh panels across the Nordic region, the United Kingdom, North America, Europe, and internationally, with a market cap of SEK8.15 billion.
Operations: The company's revenue from mesh panels amounts to €267.94 million.
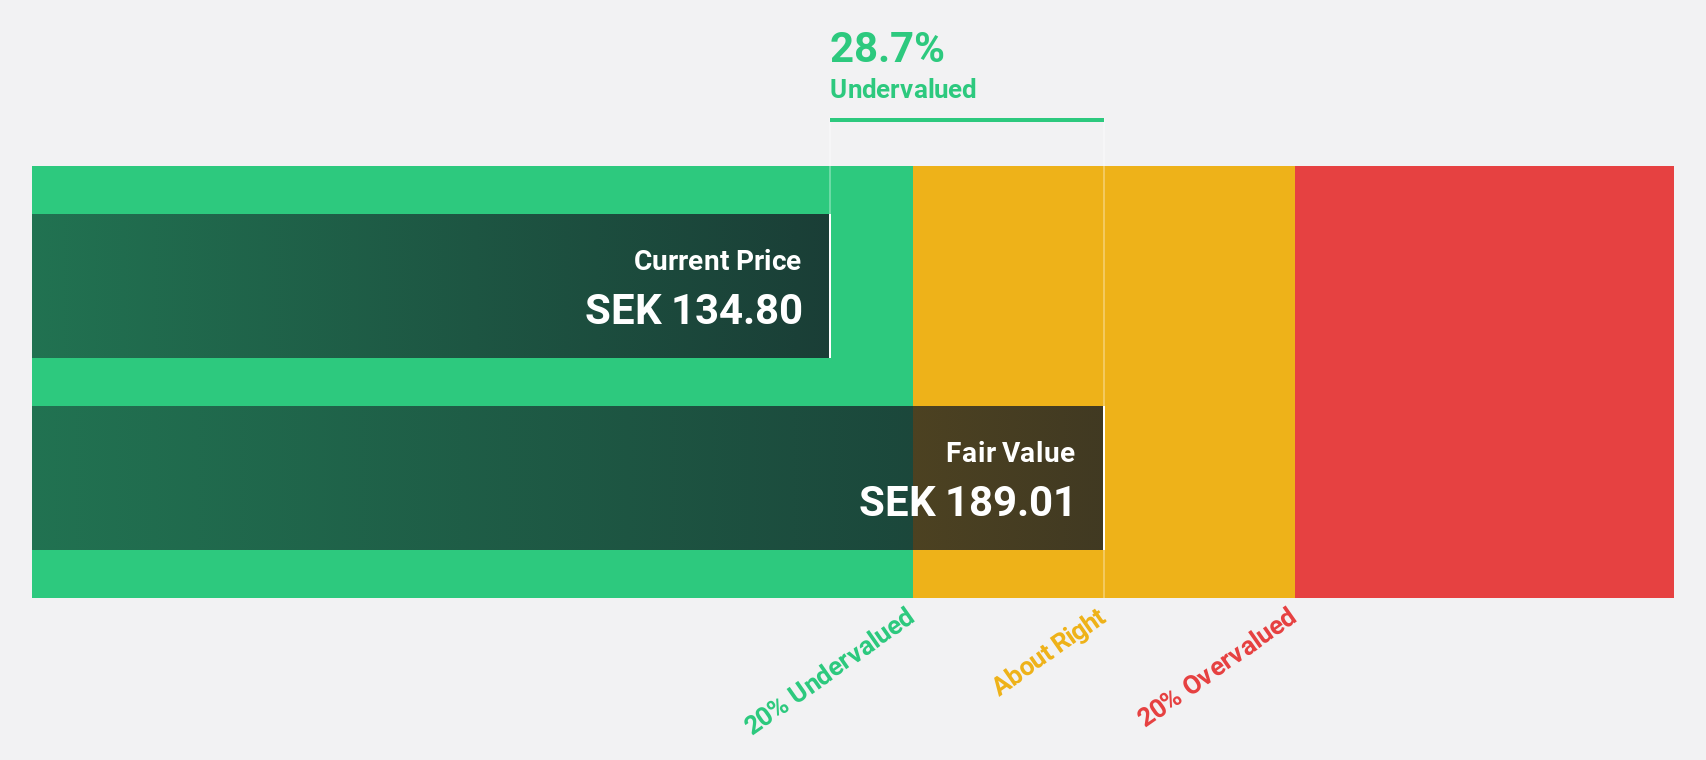
Estimated Discount To Fair Value: 26.7%
Troax Group, trading at SEK136.2, is priced below its estimated fair value of SEK185.91, highlighting potential undervaluation based on cash flows. Despite recent declines in sales and net income for the third quarter of 2025, analysts forecast significant annual earnings growth of 35.2% over the next three years, surpassing Swedish market expectations. However, the dividend yield of 2.74% is not well covered by earnings, posing a sustainability concern amidst promising growth prospects.
- In light of our recent growth report, it seems possible that Troax Group's financial performance will exceed current levels.
- Click here and access our complete balance sheet health report to understand the dynamics of Troax Group.
Next Steps
- Reveal the 199 hidden gems among our Undervalued European Stocks Based On Cash Flows screener with a single click here.
- Are any of these part of your asset mix? Tap into the analytical power of Simply Wall St's portfolio to get a 360-degree view on how they're shaping up.
- Join a community of smart investors by using Simply Wall St. It's free and delivers expert-level analysis on worldwide markets.
Interested In Other Possibilities?
- Explore high-performing small cap companies that haven't yet garnered significant analyst attention.
- Diversify your portfolio with solid dividend payers offering reliable income streams to weather potential market turbulence.
- Fuel your portfolio with companies showing strong growth potential, backed by optimistic outlooks both from analysts and management.
This article by Simply Wall St is general in nature. We provide commentary based on historical data and analyst forecasts only using an unbiased methodology and our articles are not intended to be financial advice. It does not constitute a recommendation to buy or sell any stock, and does not take account of your objectives, or your financial situation. We aim to bring you long-term focused analysis driven by fundamental data. Note that our analysis may not factor in the latest price-sensitive company announcements or qualitative material. Simply Wall St has no position in any stocks mentioned.
Valuation is complex, but we're here to simplify it.
Discover if cBrain might be undervalued or overvalued with our detailed analysis, featuring fair value estimates, potential risks, dividends, insider trades, and its financial condition.
Access Free AnalysisHave feedback on this article? Concerned about the content? Get in touch with us directly. Alternatively, email editorial-team@simplywallst.com
About CPSE:CBRAIN
cBrain
A software company, provides software solutions for government, private, education, and non-profit sectors in Denmark, rest of the European Union, and internationally.
High growth potential with excellent balance sheet.
Market Insights

Advertisement
Community Narratives
MicroVision will explode future revenue by 380.37% with a vision towards success
Fair Value US$60.00|98.4% undervalued
TH
Community Contributor
The Indispensable Artery for a New North American Economy
Fair Value CA$132.87|1.3% undervalued
TI
Community Contributor