
Advertisement
Pexip Holding ASA (OB:PEXIP) Shares Could Be 45% Below Their Intrinsic Value Estimate
Key Insights
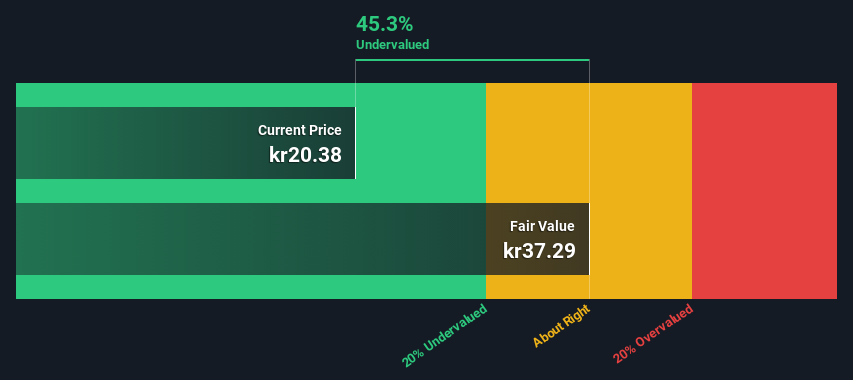
- Using the 2 Stage Free Cash Flow to Equity, Pexip Holding fair value estimate is kr37.29
- Current share price of kr20.38 suggests Pexip Holding is potentially 45% undervalued
- Industry average discount to fair value of 44% suggests Pexip Holding's peers are currently trading at a lower discount
How far off is Pexip Holding ASA (OB:PEXIP) from its intrinsic value? Using the most recent financial data, we'll take a look at whether the stock is fairly priced by taking the expected future cash flows and discounting them to their present value. The Discounted Cash Flow (DCF) model is the tool we will apply to do this. It may sound complicated, but actually it is quite simple!
Companies can be valued in a lot of ways, so we would point out that a DCF is not perfect for every situation. If you still have some burning questions about this type of valuation, take a look at the Simply Wall St analysis model.
Check out our latest analysis for Pexip Holding
The Model
We are going to use a two-stage DCF model, which, as the name states, takes into account two stages of growth. The first stage is generally a higher growth period which levels off heading towards the terminal value, captured in the second 'steady growth' period. In the first stage we need to estimate the cash flows to the business over the next ten years. Where possible we use analyst estimates, but when these aren't available we extrapolate the previous free cash flow (FCF) from the last estimate or reported value. We assume companies with shrinking free cash flow will slow their rate of shrinkage, and that companies with growing free cash flow will see their growth rate slow, over this period. We do this to reflect that growth tends to slow more in the early years than it does in later years.
Generally we assume that a dollar today is more valuable than a dollar in the future, so we need to discount the sum of these future cash flows to arrive at a present value estimate:
10-year free cash flow (FCF) forecast
| 2024 | 2025 | 2026 | 2027 | 2028 | 2029 | 2030 | 2031 | 2032 | 2033 | |
| Levered FCF (NOK, Millions) | kr101.0m | kr141.0m | kr171.6m | kr198.4m | kr220.9m | kr239.3m | kr254.3m | kr266.5m | kr276.5m | kr284.9m |
| Growth Rate Estimate Source | Analyst x1 | Analyst x1 | Est @ 21.71% | Est @ 15.61% | Est @ 11.34% | Est @ 8.35% | Est @ 6.25% | Est @ 4.79% | Est @ 3.76% | Est @ 3.05% |
| Present Value (NOK, Millions) Discounted @ 7.4% | kr94.1 | kr122 | kr139 | kr149 | kr155 | kr156 | kr155 | kr151 | kr146 | kr140 |
("Est" = FCF growth rate estimated by Simply Wall St)
Present Value of 10-year Cash Flow (PVCF) = kr1.4b
The second stage is also known as Terminal Value, this is the business's cash flow after the first stage. The Gordon Growth formula is used to calculate Terminal Value at a future annual growth rate equal to the 5-year average of the 10-year government bond yield of 1.4%. We discount the terminal cash flows to today's value at a cost of equity of 7.4%.
Terminal Value (TV)= FCF2033 × (1 + g) ÷ (r – g) = kr285m× (1 + 1.4%) ÷ (7.4%– 1.4%) = kr4.8b
Present Value of Terminal Value (PVTV)= TV / (1 + r)10= kr4.8b÷ ( 1 + 7.4%)10= kr2.4b
The total value is the sum of cash flows for the next ten years plus the discounted terminal value, which results in the Total Equity Value, which in this case is kr3.8b. To get the intrinsic value per share, we divide this by the total number of shares outstanding. Relative to the current share price of kr20.4, the company appears quite good value at a 45% discount to where the stock price trades currently. Valuations are imprecise instruments though, rather like a telescope - move a few degrees and end up in a different galaxy. Do keep this in mind.
Important Assumptions
Now the most important inputs to a discounted cash flow are the discount rate, and of course, the actual cash flows. If you don't agree with these result, have a go at the calculation yourself and play with the assumptions. The DCF also does not consider the possible cyclicality of an industry, or a company's future capital requirements, so it does not give a full picture of a company's potential performance. Given that we are looking at Pexip Holding as potential shareholders, the cost of equity is used as the discount rate, rather than the cost of capital (or weighted average cost of capital, WACC) which accounts for debt. In this calculation we've used 7.4%, which is based on a levered beta of 1.008. Beta is a measure of a stock's volatility, compared to the market as a whole. We get our beta from the industry average beta of globally comparable companies, with an imposed limit between 0.8 and 2.0, which is a reasonable range for a stable business.
SWOT Analysis for Pexip Holding
Strength
- Debt is well covered by earnings.
Weakness
- No major weaknesses identified for PEXIP.
Opportunity
- Expected to breakeven next year.
- Has sufficient cash runway for more than 3 years based on current free cash flows.
- Trading below our estimate of fair value by more than 20%.
- Significant insider buying over the past 3 months.
Threat
- Debt is not well covered by operating cash flow.
Next Steps:
Whilst important, the DCF calculation shouldn't be the only metric you look at when researching a company. It's not possible to obtain a foolproof valuation with a DCF model. Preferably you'd apply different cases and assumptions and see how they would impact the company's valuation. If a company grows at a different rate, or if its cost of equity or risk free rate changes sharply, the output can look very different. Can we work out why the company is trading at a discount to intrinsic value? For Pexip Holding, there are three pertinent aspects you should further research:
- Financial Health: Does PEXIP have a healthy balance sheet? Take a look at our free balance sheet analysis with six simple checks on key factors like leverage and risk.
- Management:Have insiders been ramping up their shares to take advantage of the market's sentiment for PEXIP's future outlook? Check out our management and board analysis with insights on CEO compensation and governance factors.
- Other Solid Businesses: Low debt, high returns on equity and good past performance are fundamental to a strong business. Why not explore our interactive list of stocks with solid business fundamentals to see if there are other companies you may not have considered!
PS. Simply Wall St updates its DCF calculation for every Norwegian stock every day, so if you want to find the intrinsic value of any other stock just search here.
New: Manage All Your Stock Portfolios in One Place
We've created the ultimate portfolio companion for stock investors, and it's free.
• Connect an unlimited number of Portfolios and see your total in one currency
• Be alerted to new Warning Signs or Risks via email or mobile
• Track the Fair Value of your stocks
Have feedback on this article? Concerned about the content? Get in touch with us directly. Alternatively, email editorial-team (at) simplywallst.com.
This article by Simply Wall St is general in nature. We provide commentary based on historical data and analyst forecasts only using an unbiased methodology and our articles are not intended to be financial advice. It does not constitute a recommendation to buy or sell any stock, and does not take account of your objectives, or your financial situation. We aim to bring you long-term focused analysis driven by fundamental data. Note that our analysis may not factor in the latest price-sensitive company announcements or qualitative material. Simply Wall St has no position in any stocks mentioned.
About OB:PEXIP
Pexip Holding
A video technology company, provides end-to-end video conferencing platform and digital infrastructure in the Americas, Europe, the Middle East, Africa, and the Asia Pacific.
Flawless balance sheet with high growth potential.
Market Insights

Advertisement
Community Narratives
MicroVision will explode future revenue by 380.37% with a vision towards success
Fair Value US$60.00|98.5% undervalued
TH
Community Contributor
The Indispensable Artery for a New North American Economy
Fair Value CA$132.87|2.3% undervalued
TI
Community Contributor