Stock Analysis
- Norway
- /
- Oil and Gas
- /
- OB:EQNR
Investors Should Be Encouraged By Equinor's (OB:EQNR) Returns On Capital

There are a few key trends to look for if we want to identify the next multi-bagger. Typically, we'll want to notice a trend of growing return on capital employed (ROCE) and alongside that, an expanding base of capital employed. Basically this means that a company has profitable initiatives that it can continue to reinvest in, which is a trait of a compounding machine. With that in mind, the ROCE of Equinor (OB:EQNR) looks great, so lets see what the trend can tell us.
Return On Capital Employed (ROCE): What Is It?
For those who don't know, ROCE is a measure of a company's yearly pre-tax profit (its return), relative to the capital employed in the business. To calculate this metric for Equinor, this is the formula:
Return on Capital Employed = Earnings Before Interest and Tax (EBIT) ÷ (Total Assets - Current Liabilities)
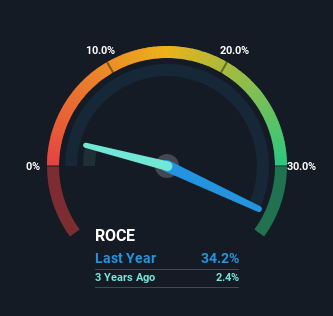
0.34 = US$37b ÷ (US$144b - US$36b) (Based on the trailing twelve months to December 2023).
So, Equinor has an ROCE of 34%. That's a fantastic return and not only that, it outpaces the average of 18% earned by companies in a similar industry.
Check out our latest analysis for Equinor
In the above chart we have measured Equinor's prior ROCE against its prior performance, but the future is arguably more important. If you're interested, you can view the analysts predictions in our free analyst report for Equinor .
What Can We Tell From Equinor's ROCE Trend?
Equinor has not disappointed with their ROCE growth. Looking at the data, we can see that even though capital employed in the business has remained relatively flat, the ROCE generated has risen by 82% over the last five years. Basically the business is generating higher returns from the same amount of capital and that is proof that there are improvements in the company's efficiencies. On that front, things are looking good so it's worth exploring what management has said about growth plans going forward.
On a side note, we noticed that the improvement in ROCE appears to be partly fueled by an increase in current liabilities. The current liabilities has increased to 25% of total assets, so the business is now more funded by the likes of its suppliers or short-term creditors. Keep an eye out for future increases because when the ratio of current liabilities to total assets gets particularly high, this can introduce some new risks for the business.
The Key Takeaway
To bring it all together, Equinor has done well to increase the returns it's generating from its capital employed. And with the stock having performed exceptionally well over the last five years, these patterns are being accounted for by investors. With that being said, we still think the promising fundamentals mean the company deserves some further due diligence.
One final note, you should learn about the 3 warning signs we've spotted with Equinor (including 1 which shouldn't be ignored) .
If you want to search for more stocks that have been earning high returns, check out this free list of stocks with solid balance sheets that are also earning high returns on equity.
Valuation is complex, but we're helping make it simple.
Find out whether Equinor is potentially over or undervalued by checking out our comprehensive analysis, which includes fair value estimates, risks and warnings, dividends, insider transactions and financial health.
View the Free AnalysisHave feedback on this article? Concerned about the content? Get in touch with us directly. Alternatively, email editorial-team (at) simplywallst.com.
This article by Simply Wall St is general in nature. We provide commentary based on historical data and analyst forecasts only using an unbiased methodology and our articles are not intended to be financial advice. It does not constitute a recommendation to buy or sell any stock, and does not take account of your objectives, or your financial situation. We aim to bring you long-term focused analysis driven by fundamental data. Note that our analysis may not factor in the latest price-sensitive company announcements or qualitative material. Simply Wall St has no position in any stocks mentioned.
About OB:EQNR
Equinor
Equinor ASA, an energy company, engages in the exploration, production, transportation, refining, and marketing of petroleum and other forms of energy in Norway and internationally.
Flawless balance sheet average dividend payer.

