Stock Analysis


Key Insights
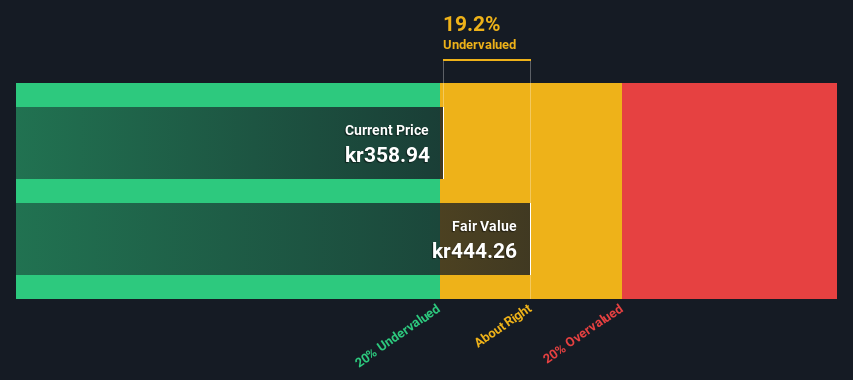
- Using the Dividend Discount Model, Equinor fair value estimate is kr444
- Equinor's kr359 share price indicates it is trading at similar levels as its fair value estimate
- Analyst price target for EQNR is US$360 which is 19% below our fair value estimate
Today we'll do a simple run through of a valuation method used to estimate the attractiveness of Equinor ASA (OB:EQNR) as an investment opportunity by projecting its future cash flows and then discounting them to today's value. This will be done using the Discounted Cash Flow (DCF) model. Don't get put off by the jargon, the math behind it is actually quite straightforward.
We generally believe that a company's value is the present value of all of the cash it will generate in the future. However, a DCF is just one valuation metric among many, and it is not without flaws. If you want to learn more about discounted cash flow, the rationale behind this calculation can be read in detail in the Simply Wall St analysis model.
View our latest analysis for Equinor
The Method
We have to calculate the value of Equinor slightly differently to other stocks because it is a oil and gas company. In this approach dividends per share (DPS) are used, as free cash flow is difficult to estimate and often not reported by analysts. Unless a company pays out the majority of its FCF as a dividend, this method will typically underestimate the value of the stock. We use the Gordon Growth Model, which assumes dividend will grow into perpetuity at a rate that can be sustained. The dividend is expected to grow at an annual growth rate equal to the 5-year average of the 10-year government bond yield of 2.0%. We then discount this figure to today's value at a cost of equity of 9.1%. Relative to the current share price of kr359, the company appears about fair value at a 19% discount to where the stock price trades currently. Valuations are imprecise instruments though, rather like a telescope - move a few degrees and end up in a different galaxy. Do keep this in mind.
Value Per Share = Expected Dividend Per Share / (Discount Rate - Perpetual Growth Rate)
= US$2.8 / (9.1% – 2.0%)
= kr444
The Assumptions
Now the most important inputs to a discounted cash flow are the discount rate, and of course, the actual cash flows. You don't have to agree with these inputs, I recommend redoing the calculations yourself and playing with them. The DCF also does not consider the possible cyclicality of an industry, or a company's future capital requirements, so it does not give a full picture of a company's potential performance. Given that we are looking at Equinor as potential shareholders, the cost of equity is used as the discount rate, rather than the cost of capital (or weighted average cost of capital, WACC) which accounts for debt. In this calculation we've used 9.1%, which is based on a levered beta of 1.429. Beta is a measure of a stock's volatility, compared to the market as a whole. We get our beta from the industry average beta of globally comparable companies, with an imposed limit between 0.8 and 2.0, which is a reasonable range for a stable business.
SWOT Analysis for Equinor
- Debt is not viewed as a risk.
- Dividends are covered by earnings and cash flows.
- Dividend is in the top 25% of dividend payers in the market.
- Earnings declined over the past year.
- Good value based on P/E ratio and estimated fair value.
- Annual earnings are forecast to decline for the next 3 years.
Next Steps:
Valuation is only one side of the coin in terms of building your investment thesis, and it shouldn't be the only metric you look at when researching a company. DCF models are not the be-all and end-all of investment valuation. Preferably you'd apply different cases and assumptions and see how they would impact the company's valuation. If a company grows at a different rate, or if its cost of equity or risk free rate changes sharply, the output can look very different. For Equinor, we've put together three important elements you should explore:
- Risks: Every company has them, and we've spotted 2 warning signs for Equinor (of which 1 makes us a bit uncomfortable!) you should know about.
- Future Earnings: How does EQNR's growth rate compare to its peers and the wider market? Dig deeper into the analyst consensus number for the upcoming years by interacting with our free analyst growth expectation chart.
- Other Solid Businesses: Low debt, high returns on equity and good past performance are fundamental to a strong business. Why not explore our interactive list of stocks with solid business fundamentals to see if there are other companies you may not have considered!
PS. The Simply Wall St app conducts a discounted cash flow valuation for every stock on the OB every day. If you want to find the calculation for other stocks just search here.
Valuation is complex, but we're helping make it simple.
Find out whether Equinor is potentially over or undervalued by checking out our comprehensive analysis, which includes fair value estimates, risks and warnings, dividends, insider transactions and financial health.
View the Free AnalysisHave feedback on this article? Concerned about the content? Get in touch with us directly. Alternatively, email editorial-team (at) simplywallst.com.
This article by Simply Wall St is general in nature. We provide commentary based on historical data and analyst forecasts only using an unbiased methodology and our articles are not intended to be financial advice. It does not constitute a recommendation to buy or sell any stock, and does not take account of your objectives, or your financial situation. We aim to bring you long-term focused analysis driven by fundamental data. Note that our analysis may not factor in the latest price-sensitive company announcements or qualitative material. Simply Wall St has no position in any stocks mentioned.
About OB:EQNR
Equinor
Equinor ASA, an energy company, engages in the exploration, production, transportation, refining, and marketing of petroleum and other forms of energy in Norway and internationally.
Flawless balance sheet average dividend payer.
