
Advertisement
Inin Group AS (OB:ININ) shareholders have had their patience rewarded with a 28% share price jump in the last month. Unfortunately, despite the strong performance over the last month, the full year gain of 3.0% isn't as attractive.
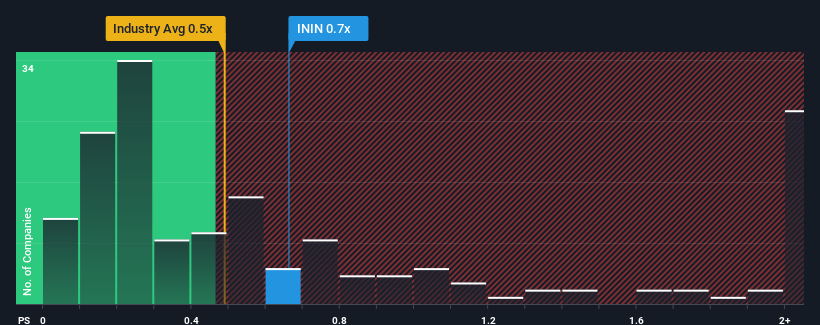
Although its price has surged higher, you could still be forgiven for feeling indifferent about Inin Group's P/S ratio of 0.7x, since the median price-to-sales (or "P/S") ratio for the Construction industry in Norway is also close to 0.8x. However, investors might be overlooking a clear opportunity or potential setback if there is no rational basis for the P/S.
View our latest analysis for Inin Group
How Has Inin Group Performed Recently?
With revenue growth that's superior to most other companies of late, Inin Group has been doing relatively well. Perhaps the market is expecting this level of performance to taper off, keeping the P/S from soaring. If the company manages to stay the course, then investors should be rewarded with a share price that matches its revenue figures.
Want the full picture on analyst estimates for the company? Then our free report on Inin Group will help you uncover what's on the horizon.How Is Inin Group's Revenue Growth Trending?
In order to justify its P/S ratio, Inin Group would need to produce growth that's similar to the industry.
Taking a look back first, we see that the company's revenues underwent some rampant growth over the last 12 months. Although, its longer-term performance hasn't been anywhere near as strong with three-year revenue growth being relatively non-existent overall. Therefore, it's fair to say that revenue growth has been inconsistent recently for the company.
Shifting to the future, estimates from the one analyst covering the company suggest revenue should grow by 42% per annum over the next three years. With the industry predicted to deliver 49% growth per annum, the company is positioned for a weaker revenue result.
With this information, we find it interesting that Inin Group is trading at a fairly similar P/S compared to the industry. It seems most investors are ignoring the fairly limited growth expectations and are willing to pay up for exposure to the stock. Maintaining these prices will be difficult to achieve as this level of revenue growth is likely to weigh down the shares eventually.
The Final Word
Inin Group's stock has a lot of momentum behind it lately, which has brought its P/S level with the rest of the industry. Using the price-to-sales ratio alone to determine if you should sell your stock isn't sensible, however it can be a practical guide to the company's future prospects.
Given that Inin Group's revenue growth projections are relatively subdued in comparison to the wider industry, it comes as a surprise to see it trading at its current P/S ratio. When we see companies with a relatively weaker revenue outlook compared to the industry, we suspect the share price is at risk of declining, sending the moderate P/S lower. This places shareholders' investments at risk and potential investors in danger of paying an unnecessary premium.
Having said that, be aware Inin Group is showing 2 warning signs in our investment analysis, you should know about.
If you're unsure about the strength of Inin Group's business, why not explore our interactive list of stocks with solid business fundamentals for some other companies you may have missed.
New: AI Stock Screener & Alerts
Our new AI Stock Screener scans the market every day to uncover opportunities.
• Dividend Powerhouses (3%+ Yield)
• Undervalued Small Caps with Insider Buying
• High growth Tech and AI Companies
Or build your own from over 50 metrics.
Have feedback on this article? Concerned about the content? Get in touch with us directly. Alternatively, email editorial-team (at) simplywallst.com.
This article by Simply Wall St is general in nature. We provide commentary based on historical data and analyst forecasts only using an unbiased methodology and our articles are not intended to be financial advice. It does not constitute a recommendation to buy or sell any stock, and does not take account of your objectives, or your financial situation. We aim to bring you long-term focused analysis driven by fundamental data. Note that our analysis may not factor in the latest price-sensitive company announcements or qualitative material. Simply Wall St has no position in any stocks mentioned.
About OB:ININ
Inin Group
An investment company, focuses on the infrastructure and industry services in Norway, Sweden, and internationally.
Good value with mediocre balance sheet.
Market Insights

Advertisement
Community Narratives
The company that turned a verb into a global necessity and basically runs the modern internet, digital ads, smartphones, maps, and AI.
Fair Value US$300.00|5.1% undervalued
OS
Community Contributor
Flowers Foods Pays A Fair Price For Health
Fair Value US$16.12|27.7% undervalued
NV
Community Contributor
TMX Group will thrive with 33.3% profit margin and enduring market moat
Fair Value CA$49.90|0.2% overvalued
LI
Community Contributor
The "Molecular Pencil": Why Beam's Technology is Built to Win
Fair Value US$65.01|64.4% undervalued
DA
Community Contributor