Stock Analysis
- Netherlands
- /
- Electrical
- /
- ENXTAM:TWEKA
Despite delivering investors losses of 8.3% over the past 1 year, TKH Group (AMS:TWEKA) has been growing its earnings


Passive investing in an index fund is a good way to ensure your own returns roughly match the overall market. But if you buy individual stocks, you can do both better or worse than that. Unfortunately the TKH Group N.V. (AMS:TWEKA) share price slid 12% over twelve months. That's well below the market return of 21%. At least the damage isn't so bad if you look at the last three years, since the stock is down 5.4% in that time.
While the stock has risen 4.6% in the past week but long term shareholders are still in the red, let's see what the fundamentals can tell us.
View our latest analysis for TKH Group
To quote Buffett, 'Ships will sail around the world but the Flat Earth Society will flourish. There will continue to be wide discrepancies between price and value in the marketplace...' By comparing earnings per share (EPS) and share price changes over time, we can get a feel for how investor attitudes to a company have morphed over time.
During the unfortunate twelve months during which the TKH Group share price fell, it actually saw its earnings per share (EPS) improve by 22%. It could be that the share price was previously over-hyped.
It's surprising to see the share price fall so much, despite the improved EPS. So it's well worth checking out some other metrics, too.
We don't see any weakness in the TKH Group's dividend so the steady payout can't really explain the share price drop. From what we can see, revenue is pretty flat, so that doesn't really explain the share price drop. Unless, of course, the market was expecting a revenue uptick.
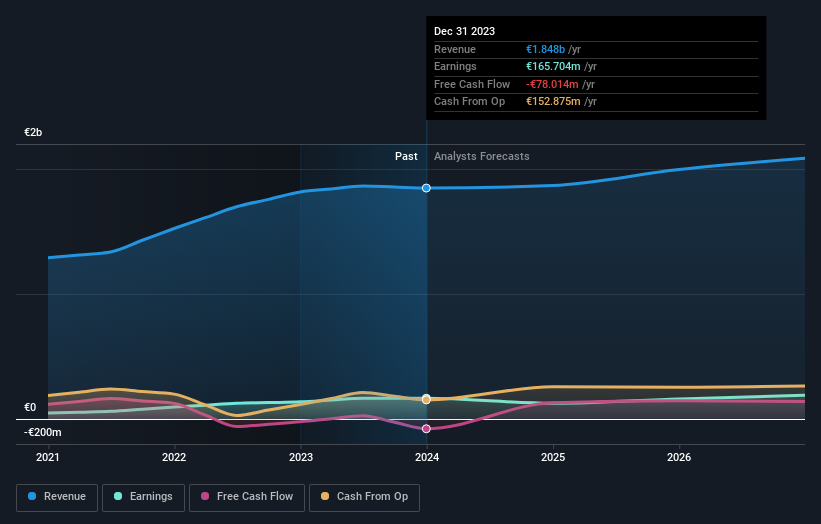
The graphic below depicts how earnings and revenue have changed over time (unveil the exact values by clicking on the image).
We know that TKH Group has improved its bottom line over the last three years, but what does the future have in store? If you are thinking of buying or selling TKH Group stock, you should check out this FREE detailed report on its balance sheet.
What About Dividends?
It is important to consider the total shareholder return, as well as the share price return, for any given stock. The TSR is a return calculation that accounts for the value of cash dividends (assuming that any dividend received was reinvested) and the calculated value of any discounted capital raisings and spin-offs. It's fair to say that the TSR gives a more complete picture for stocks that pay a dividend. As it happens, TKH Group's TSR for the last 1 year was -8.3%, which exceeds the share price return mentioned earlier. This is largely a result of its dividend payments!
A Different Perspective
While the broader market gained around 21% in the last year, TKH Group shareholders lost 8.3% (even including dividends). However, keep in mind that even the best stocks will sometimes underperform the market over a twelve month period. On the bright side, long term shareholders have made money, with a gain of 3% per year over half a decade. It could be that the recent sell-off is an opportunity, so it may be worth checking the fundamental data for signs of a long term growth trend. While it is well worth considering the different impacts that market conditions can have on the share price, there are other factors that are even more important. Take risks, for example - TKH Group has 3 warning signs (and 1 which shouldn't be ignored) we think you should know about.
If you are like me, then you will not want to miss this free list of undervalued small caps that insiders are buying.
Please note, the market returns quoted in this article reflect the market weighted average returns of stocks that currently trade on Dutch exchanges.
Valuation is complex, but we're helping make it simple.
Find out whether TKH Group is potentially over or undervalued by checking out our comprehensive analysis, which includes fair value estimates, risks and warnings, dividends, insider transactions and financial health.
View the Free AnalysisHave feedback on this article? Concerned about the content? Get in touch with us directly. Alternatively, email editorial-team (at) simplywallst.com.
This article by Simply Wall St is general in nature. We provide commentary based on historical data and analyst forecasts only using an unbiased methodology and our articles are not intended to be financial advice. It does not constitute a recommendation to buy or sell any stock, and does not take account of your objectives, or your financial situation. We aim to bring you long-term focused analysis driven by fundamental data. Note that our analysis may not factor in the latest price-sensitive company announcements or qualitative material. Simply Wall St has no position in any stocks mentioned.
About ENXTAM:TWEKA
TKH Group
Develops and delivers smart vision, smart manufacturing, and smart connectivity systems in the Netherlands, Europe, Asia, North America, and internationally.
Very undervalued with proven track record.

