- Netherlands
- /
- Trade Distributors
- /
- ENXTAM:IMCD
Investors in IMCD (AMS:IMCD) have seen respectable returns of 100% over the past five years


Passive investing in index funds can generate returns that roughly match the overall market. But in our experience, buying the right stocks can give your wealth a significant boost. For example, the IMCD N.V. (AMS:IMCD) share price is up 88% in the last five years, slightly above the market return. In stark contrast, the stock price has actually fallen 4.6% in the last year.
With that in mind, it's worth seeing if the company's underlying fundamentals have been the driver of long term performance, or if there are some discrepancies.
View our latest analysis for IMCD
To quote Buffett, 'Ships will sail around the world but the Flat Earth Society will flourish. There will continue to be wide discrepancies between price and value in the marketplace...' By comparing earnings per share (EPS) and share price changes over time, we can get a feel for how investor attitudes to a company have morphed over time.
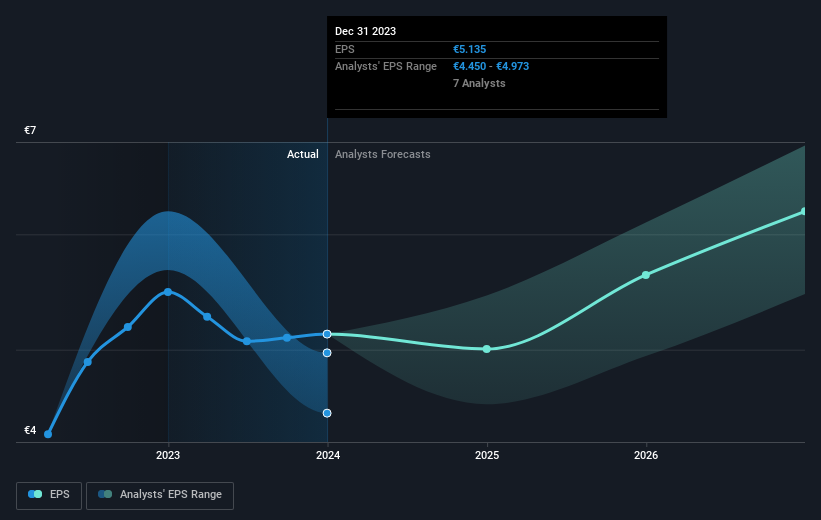
Over half a decade, IMCD managed to grow its earnings per share at 22% a year. The EPS growth is more impressive than the yearly share price gain of 13% over the same period. So it seems the market isn't so enthusiastic about the stock these days.
The company's earnings per share (over time) is depicted in the image below (click to see the exact numbers).
We consider it positive that insiders have made significant purchases in the last year. Having said that, most people consider earnings and revenue growth trends to be a more meaningful guide to the business. It might be well worthwhile taking a look at our free report on IMCD's earnings, revenue and cash flow.
What About Dividends?
When looking at investment returns, it is important to consider the difference between total shareholder return (TSR) and share price return. The TSR is a return calculation that accounts for the value of cash dividends (assuming that any dividend received was reinvested) and the calculated value of any discounted capital raisings and spin-offs. So for companies that pay a generous dividend, the TSR is often a lot higher than the share price return. In the case of IMCD, it has a TSR of 100% for the last 5 years. That exceeds its share price return that we previously mentioned. The dividends paid by the company have thusly boosted the total shareholder return.
A Different Perspective
Investors in IMCD had a tough year, with a total loss of 3.1% (including dividends), against a market gain of about 18%. Even the share prices of good stocks drop sometimes, but we want to see improvements in the fundamental metrics of a business, before getting too interested. On the bright side, long term shareholders have made money, with a gain of 15% per year over half a decade. It could be that the recent sell-off is an opportunity, so it may be worth checking the fundamental data for signs of a long term growth trend. It's always interesting to track share price performance over the longer term. But to understand IMCD better, we need to consider many other factors. Case in point: We've spotted 1 warning sign for IMCD you should be aware of.
There are plenty of other companies that have insiders buying up shares. You probably do not want to miss this free list of undervalued small cap companies that insiders are buying.
Please note, the market returns quoted in this article reflect the market weighted average returns of stocks that currently trade on Dutch exchanges.
New: AI Stock Screener & Alerts
Our new AI Stock Screener scans the market every day to uncover opportunities.
• Dividend Powerhouses (3%+ Yield)
• Undervalued Small Caps with Insider Buying
• High growth Tech and AI Companies
Or build your own from over 50 metrics.
Have feedback on this article? Concerned about the content? Get in touch with us directly. Alternatively, email editorial-team (at) simplywallst.com.
This article by Simply Wall St is general in nature. We provide commentary based on historical data and analyst forecasts only using an unbiased methodology and our articles are not intended to be financial advice. It does not constitute a recommendation to buy or sell any stock, and does not take account of your objectives, or your financial situation. We aim to bring you long-term focused analysis driven by fundamental data. Note that our analysis may not factor in the latest price-sensitive company announcements or qualitative material. Simply Wall St has no position in any stocks mentioned.
About ENXTAM:IMCD
IMCD
Distributes, markets, and sells specialty chemicals and ingredients in the Netherlands, rest of Europe, the Middle East, Africa, North America, South America, and the Asia-Pacific.
Adequate balance sheet with questionable track record.
