
Advertisement
- Malaysia
- /
- Telecom Services and Carriers
- /
- KLSE:SEDANIA
Market Cool On Sedania Innovator Berhad's (KLSE:SEDANIA) Revenues Pushing Shares 54% Lower
Sedania Innovator Berhad (KLSE:SEDANIA) shares have retraced a considerable 54% in the last month, reversing a fair amount of their solid recent performance. The drop over the last 30 days has capped off a tough year for shareholders, with the share price down 17% in that time.
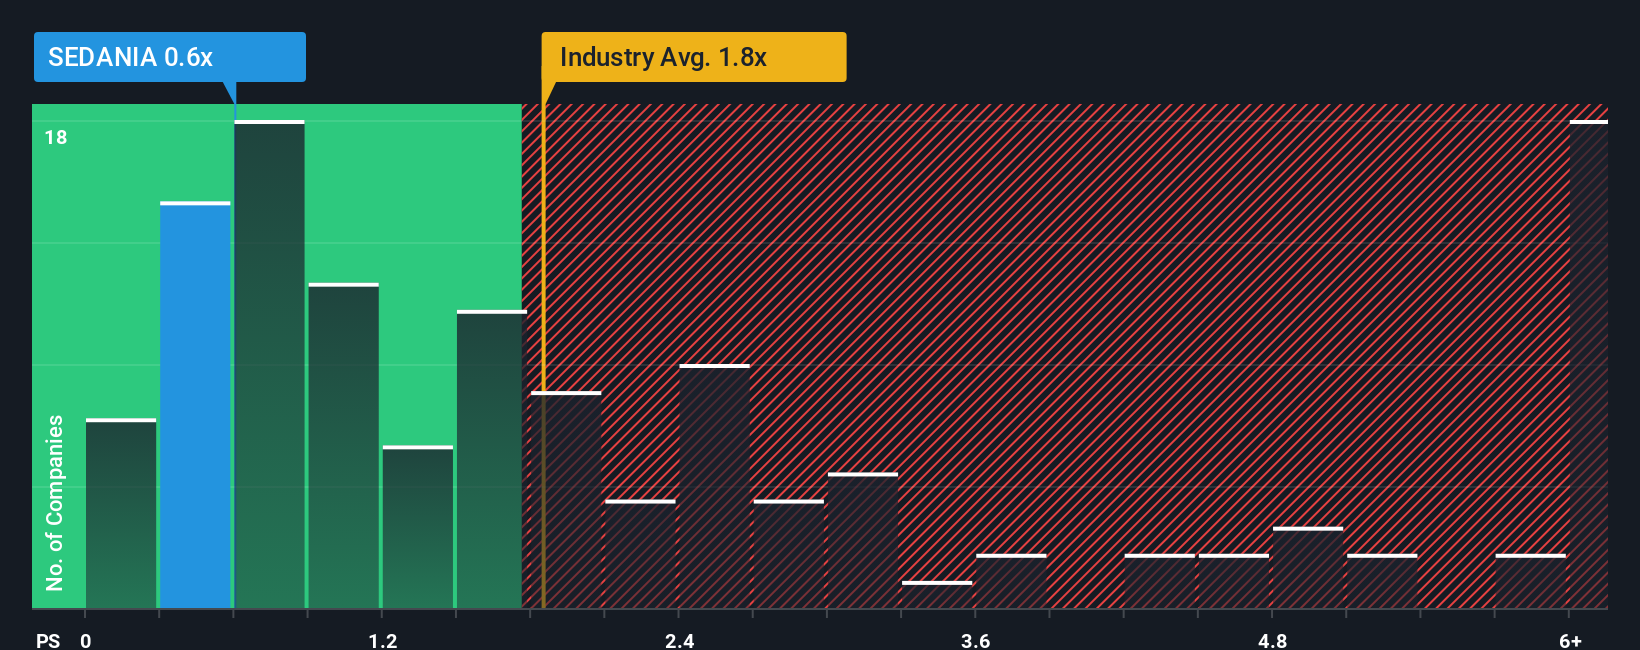
Following the heavy fall in price, it would be understandable if you think Sedania Innovator Berhad is a stock with good investment prospects with a price-to-sales ratios (or "P/S") of 0.6x, considering almost half the companies in Malaysia's Telecom industry have P/S ratios above 1.2x. Nonetheless, we'd need to dig a little deeper to determine if there is a rational basis for the reduced P/S.
See our latest analysis for Sedania Innovator Berhad
How Sedania Innovator Berhad Has Been Performing
Recent times have been quite advantageous for Sedania Innovator Berhad as its revenue has been rising very briskly. It might be that many expect the strong revenue performance to degrade substantially, which has repressed the P/S ratio. If that doesn't eventuate, then existing shareholders have reason to be quite optimistic about the future direction of the share price.
Although there are no analyst estimates available for Sedania Innovator Berhad, take a look at this free data-rich visualisation to see how the company stacks up on earnings, revenue and cash flow.Is There Any Revenue Growth Forecasted For Sedania Innovator Berhad?
In order to justify its P/S ratio, Sedania Innovator Berhad would need to produce sluggish growth that's trailing the industry.
If we review the last year of revenue growth, the company posted a terrific increase of 57%. The strong recent performance means it was also able to grow revenue by 108% in total over the last three years. So we can start by confirming that the company has done a great job of growing revenue over that time.
Comparing that recent medium-term revenue trajectory with the industry's one-year growth forecast of 6.4% shows it's noticeably more attractive.
In light of this, it's peculiar that Sedania Innovator Berhad's P/S sits below the majority of other companies. Apparently some shareholders believe the recent performance has exceeded its limits and have been accepting significantly lower selling prices.
What We Can Learn From Sedania Innovator Berhad's P/S?
Sedania Innovator Berhad's recently weak share price has pulled its P/S back below other Telecom companies. It's argued the price-to-sales ratio is an inferior measure of value within certain industries, but it can be a powerful business sentiment indicator.
We're very surprised to see Sedania Innovator Berhad currently trading on a much lower than expected P/S since its recent three-year growth is higher than the wider industry forecast. Potential investors that are sceptical over continued revenue performance may be preventing the P/S ratio from matching previous strong performance. At least price risks look to be very low if recent medium-term revenue trends continue, but investors seem to think future revenue could see a lot of volatility.
It is also worth noting that we have found 2 warning signs for Sedania Innovator Berhad (1 shouldn't be ignored!) that you need to take into consideration.
If strong companies turning a profit tickle your fancy, then you'll want to check out this free list of interesting companies that trade on a low P/E (but have proven they can grow earnings).
New: Manage All Your Stock Portfolios in One Place
We've created the ultimate portfolio companion for stock investors, and it's free.
• Connect an unlimited number of Portfolios and see your total in one currency
• Be alerted to new Warning Signs or Risks via email or mobile
• Track the Fair Value of your stocks
Have feedback on this article? Concerned about the content? Get in touch with us directly. Alternatively, email editorial-team (at) simplywallst.com.
This article by Simply Wall St is general in nature. We provide commentary based on historical data and analyst forecasts only using an unbiased methodology and our articles are not intended to be financial advice. It does not constitute a recommendation to buy or sell any stock, and does not take account of your objectives, or your financial situation. We aim to bring you long-term focused analysis driven by fundamental data. Note that our analysis may not factor in the latest price-sensitive company announcements or qualitative material. Simply Wall St has no position in any stocks mentioned.
About KLSE:SEDANIA
Sedania Innovator Berhad
An investment holding company, provides integrated telecommunications services in Malaysia, Europe, rest of Asia, and internationally.
Excellent balance sheet with low risk.
Market Insights

Advertisement
Community Narratives
MicroVision will explode future revenue by 380.37% with a vision towards success
Fair Value US$60.00|98.5% undervalued
TH
Community Contributor
The Indispensable Artery for a New North American Economy
Fair Value CA$132.87|2.3% undervalued
TI
Community Contributor