
Advertisement
Securemetric Berhad (KLSE:SMETRIC) Stock's 27% Dive Might Signal An Opportunity But It Requires Some Scrutiny
Securemetric Berhad (KLSE:SMETRIC) shareholders that were waiting for something to happen have been dealt a blow with a 27% share price drop in the last month. The drop over the last 30 days has capped off a tough year for shareholders, with the share price down 45% in that time.
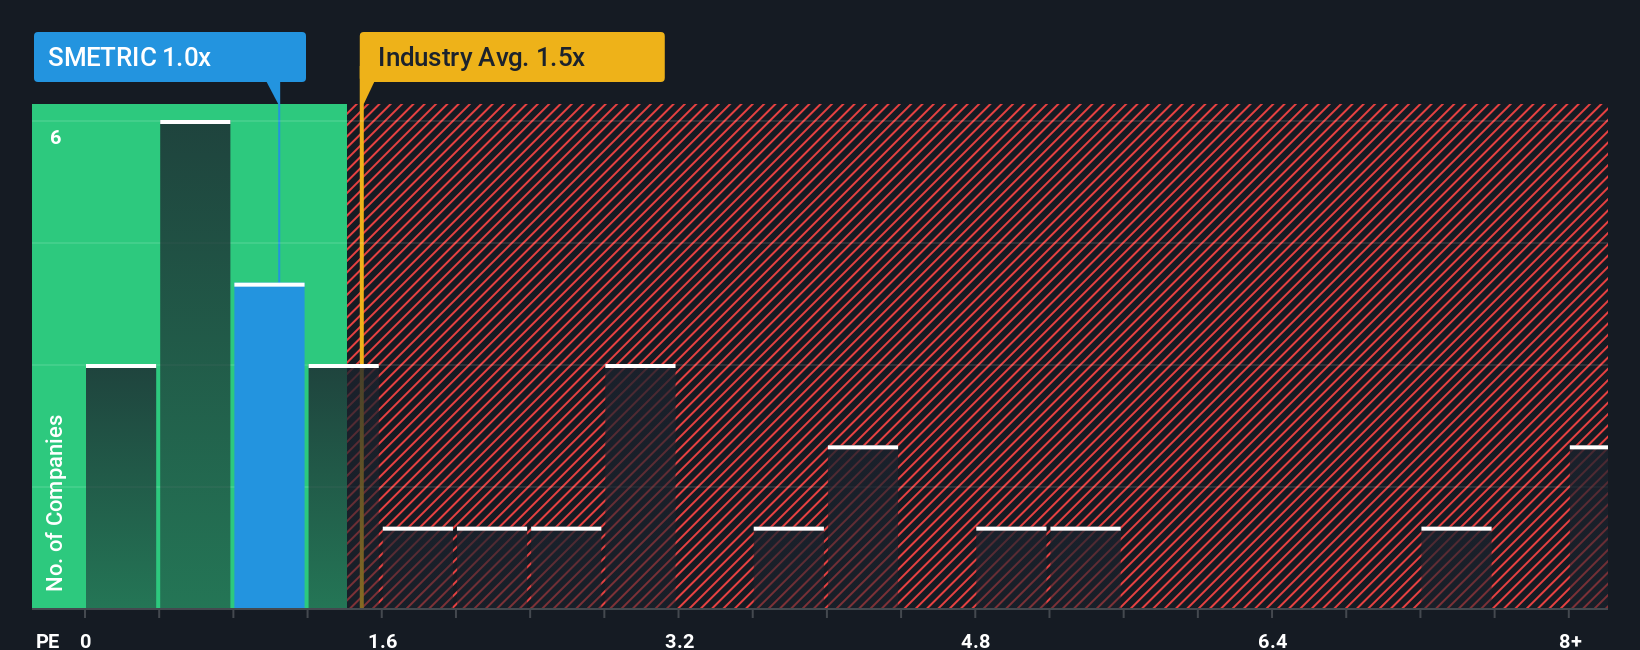
Although its price has dipped substantially, it's still not a stretch to say that Securemetric Berhad's price-to-sales (or "P/S") ratio of 1x right now seems quite "middle-of-the-road" compared to the Software industry in Malaysia, where the median P/S ratio is around 1.5x. However, investors might be overlooking a clear opportunity or potential setback if there is no rational basis for the P/S.
Check out our latest analysis for Securemetric Berhad
How Has Securemetric Berhad Performed Recently?
Securemetric Berhad has been doing a good job lately as it's been growing revenue at a solid pace. One possibility is that the P/S is moderate because investors think this respectable revenue growth might not be enough to outperform the broader industry in the near future. If you like the company, you'd be hoping this isn't the case so that you could potentially pick up some stock while it's not quite in favour.
Although there are no analyst estimates available for Securemetric Berhad, take a look at this free data-rich visualisation to see how the company stacks up on earnings, revenue and cash flow.How Is Securemetric Berhad's Revenue Growth Trending?
In order to justify its P/S ratio, Securemetric Berhad would need to produce growth that's similar to the industry.
Retrospectively, the last year delivered a decent 14% gain to the company's revenues. Pleasingly, revenue has also lifted 121% in aggregate from three years ago, partly thanks to the last 12 months of growth. Accordingly, shareholders would have definitely welcomed those medium-term rates of revenue growth.
Comparing that to the industry, which is only predicted to deliver 24% growth in the next 12 months, the company's momentum is stronger based on recent medium-term annualised revenue results.
In light of this, it's curious that Securemetric Berhad's P/S sits in line with the majority of other companies. Apparently some shareholders believe the recent performance is at its limits and have been accepting lower selling prices.
What Does Securemetric Berhad's P/S Mean For Investors?
Securemetric Berhad's plummeting stock price has brought its P/S back to a similar region as the rest of the industry. Generally, our preference is to limit the use of the price-to-sales ratio to establishing what the market thinks about the overall health of a company.
We've established that Securemetric Berhad currently trades on a lower than expected P/S since its recent three-year growth is higher than the wider industry forecast. There could be some unobserved threats to revenue preventing the P/S ratio from matching this positive performance. It appears some are indeed anticipating revenue instability, because the persistence of these recent medium-term conditions would normally provide a boost to the share price.
Don't forget that there may be other risks. For instance, we've identified 2 warning signs for Securemetric Berhad (1 doesn't sit too well with us) you should be aware of.
If you're unsure about the strength of Securemetric Berhad's business, why not explore our interactive list of stocks with solid business fundamentals for some other companies you may have missed.
New: Manage All Your Stock Portfolios in One Place
We've created the ultimate portfolio companion for stock investors, and it's free.
• Connect an unlimited number of Portfolios and see your total in one currency
• Be alerted to new Warning Signs or Risks via email or mobile
• Track the Fair Value of your stocks
Have feedback on this article? Concerned about the content? Get in touch with us directly. Alternatively, email editorial-team (at) simplywallst.com.
This article by Simply Wall St is general in nature. We provide commentary based on historical data and analyst forecasts only using an unbiased methodology and our articles are not intended to be financial advice. It does not constitute a recommendation to buy or sell any stock, and does not take account of your objectives, or your financial situation. We aim to bring you long-term focused analysis driven by fundamental data. Note that our analysis may not factor in the latest price-sensitive company announcements or qualitative material. Simply Wall St has no position in any stocks mentioned.
About KLSE:SMETRIC
Securemetric Berhad
Provides digital security solutions in Malaysia, Vietnam, the Philippines, Indonesia, the United States, Singapore, and internationally.
Flawless balance sheet with proven track record.
Similar Companies
Market Insights

Advertisement
Community Narratives
MicroVision will explode future revenue by 380.37% with a vision towards success
Fair Value US$60.00|98.5% undervalued
TH
Community Contributor
The Indispensable Artery for a New North American Economy
Fair Value CA$132.87|1.3% undervalued
TI
Community Contributor