Advertisement
Microlink Solutions Berhad (KLSE:MICROLN) Surges 28% Yet Its Low P/S Is No Reason For Excitement
Microlink Solutions Berhad (KLSE:MICROLN) shareholders are no doubt pleased to see that the share price has bounced 28% in the last month, although it is still struggling to make up recently lost ground. Still, the 30-day jump doesn't change the fact that longer term shareholders have seen their stock decimated by the 57% share price drop in the last twelve months.
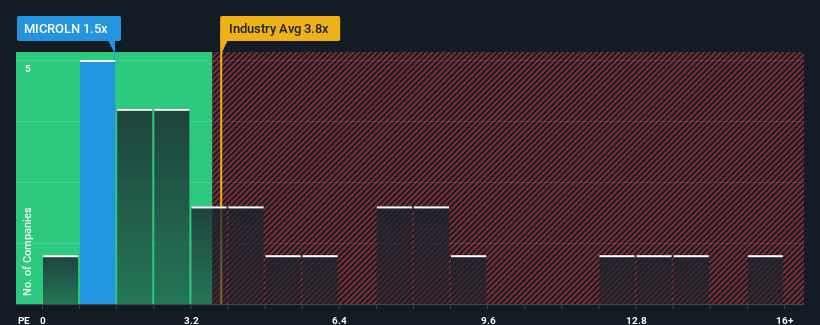
In spite of the firm bounce in price, Microlink Solutions Berhad may still look like a strong buying opportunity at present with its price-to-sales (or "P/S") ratio of 1.5x, considering almost half of all companies in the Software industry in Malaysia have P/S ratios greater than 3.8x and even P/S higher than 8x aren't out of the ordinary. However, the P/S might be quite low for a reason and it requires further investigation to determine if it's justified.
See our latest analysis for Microlink Solutions Berhad
How Microlink Solutions Berhad Has Been Performing
Revenue has risen firmly for Microlink Solutions Berhad recently, which is pleasing to see. One possibility is that the P/S is low because investors think this respectable revenue growth might actually underperform the broader industry in the near future. Those who are bullish on Microlink Solutions Berhad will be hoping that this isn't the case, so that they can pick up the stock at a lower valuation.
Although there are no analyst estimates available for Microlink Solutions Berhad, take a look at this free data-rich visualisation to see how the company stacks up on earnings, revenue and cash flow.Is There Any Revenue Growth Forecasted For Microlink Solutions Berhad?
In order to justify its P/S ratio, Microlink Solutions Berhad would need to produce anemic growth that's substantially trailing the industry.
If we review the last year of revenue growth, the company posted a worthy increase of 14%. Revenue has also lifted 29% in aggregate from three years ago, partly thanks to the last 12 months of growth. So we can start by confirming that the company has actually done a good job of growing revenue over that time.
Comparing that to the industry, which is predicted to deliver 25% growth in the next 12 months, the company's momentum is weaker, based on recent medium-term annualised revenue results.
In light of this, it's understandable that Microlink Solutions Berhad's P/S sits below the majority of other companies. Apparently many shareholders weren't comfortable holding on to something they believe will continue to trail the wider industry.
What Does Microlink Solutions Berhad's P/S Mean For Investors?
Microlink Solutions Berhad's recent share price jump still sees fails to bring its P/S alongside the industry median. While the price-to-sales ratio shouldn't be the defining factor in whether you buy a stock or not, it's quite a capable barometer of revenue expectations.
Our examination of Microlink Solutions Berhad confirms that the company's revenue trends over the past three-year years are a key factor in its low price-to-sales ratio, as we suspected, given they fall short of current industry expectations. Right now shareholders are accepting the low P/S as they concede future revenue probably won't provide any pleasant surprises. If recent medium-term revenue trends continue, it's hard to see the share price experience a reversal of fortunes anytime soon.
We don't want to rain on the parade too much, but we did also find 3 warning signs for Microlink Solutions Berhad (1 makes us a bit uncomfortable!) that you need to be mindful of.
If you're unsure about the strength of Microlink Solutions Berhad's business, why not explore our interactive list of stocks with solid business fundamentals for some other companies you may have missed.
New: Manage All Your Stock Portfolios in One Place
We've created the ultimate portfolio companion for stock investors, and it's free.
• Connect an unlimited number of Portfolios and see your total in one currency
• Be alerted to new Warning Signs or Risks via email or mobile
• Track the Fair Value of your stocks
Have feedback on this article? Concerned about the content? Get in touch with us directly. Alternatively, email editorial-team (at) simplywallst.com.
This article by Simply Wall St is general in nature. We provide commentary based on historical data and analyst forecasts only using an unbiased methodology and our articles are not intended to be financial advice. It does not constitute a recommendation to buy or sell any stock, and does not take account of your objectives, or your financial situation. We aim to bring you long-term focused analysis driven by fundamental data. Note that our analysis may not factor in the latest price-sensitive company announcements or qualitative material. Simply Wall St has no position in any stocks mentioned.
About KLSE:MICROLN
Microlink Solutions Berhad
An investment holding company, researches and develops information technology solutions to the financial services industry in Malaysia and internationally.
Low risk and slightly overvalued.
Similar Companies
Market Insights


Advertisement
Weekly Picks
LO


Lou_Basenese on Optimi Health ·
The Only Psychedelic Company Already Selling MDMA and Psilocybin to Real Patients, Yet Priced Like It Doesn’t Exist
Fair Value:US$1155.3% undervalued
51 followersusers have followed this narrative
2 commentsusers have commented on this narrative
9 likesusers have liked this narrative
BL


BlackGoat on IREN ·
IREN's Bold Moves in Sustainable Bitcoin Mining & AI Data Centers
Fair Value:US$71.4849.2% undervalued
204 followersusers have followed this narrative
6 commentsusers have commented on this narrative
32 likesusers have liked this narrative
HE


HedgeY on Arm Holdings ·
The Architecture Layer of AI Computing - But Priced Like the Future Already Arrived?
Fair Value:US$43038.1% undervalued
9 followersusers have followed this narrative
1 commentusers have commented on this narrative
3 likesusers have liked this narrative
HI


Hidden_Rock_Capital on Fiserv ·
Temporary "perfect storm" leads to opportunity to buy financial services leader for less than 5x long-term earnings
Fair Value:US$119.9956.4% undervalued
13 followersusers have followed this narrative
0 commentsusers have commented on this narrative
6 likesusers have liked this narrative
Recently Updated Narratives
EU


European_Hidden_Gem_Stocks on MINT Société anonyme ·
Mint SA: A French Micro-Cap Energy Retailer Worth Watching
Fair Value:€1153.1% undervalued
1 followerusers have followed this narrative
0 commentsusers have commented on this narrative
0 likesusers have liked this narrative
KA


kaspertidemann on BAR DJUS ·
The Best Season Is Still Ahead
Fair Value:DKK 4.120.5% undervalued
1 followerusers have followed this narrative
0 commentsusers have commented on this narrative
0 likesusers have liked this narrative
CL


Clive_Thompson on Green Tea Group ·
One of China's Fastest-Growing Restaurant Chains Trades on Just 7x Earnings and an 8% Dividend
Fair Value:HK$8.728.9% undervalued
1 followerusers have followed this narrative
0 commentsusers have commented on this narrative
0 likesusers have liked this narrative
Popular Narratives
CU

CubanEros on Microsoft ·
A wonderful business at reasonable price.
Fair Value:US$419.917.3% undervalued
86 followersusers have followed this narrative
0 commentsusers have commented on this narrative
6 likesusers have liked this narrative
OS


oscargarcia on NVIDIA ·
The company that went from selling GPUs to gamers to becoming the AI arms dealer of the 21st century.
Fair Value:US$28029.8% undervalued
195 followersusers have followed this narrative
9 commentsusers have commented on this narrative
15 likesusers have liked this narrative
BE

benjamin_lvieq on PayPal Holdings ·
PayPal: PayPal Doesn't Need to Grow – It Needs to Stop Falling – A Mispriced Cash Machine With a Cannibal Buyback
Fair Value:US$6513.7% undervalued
72 followersusers have followed this narrative
2 commentsusers have commented on this narrative
11 likesusers have liked this narrative
Trending Discussion
DE

derek_3wsdg on Teladoc Health ·
You’ve overlooked the activist investor factor. Travis Cocke’s Voss has announced 5% ownership through a 13G filing. They’ve added to that 5% since, and in doing so, have created a structural trap door for 27.42 Million Shares actively sold short. Chuck will announce lots of positives on July 29 but it’s what Voss announces shortly after that will rock the overextended Teledoc shorts. The Walmart partnership is the tip of the iceberg. The market is missing the sheer regulatory and enterprise friction of modern corporate healthcare. Teladoc isn't a "consumer app"; it is the primary digital infrastructure integrated directly into the legacy backends of Tier-1 insurance companies and fortune 500 employers, covering 105 million+ lives. Teladoc is acting as the digital top-of-funnel engine for the world's largest retailer. If Voss pushes the narrative that Teladoc is effectively the outsourced digital brain of Walmart's entire healthcare footprint, the fair value shifts from a basic health multiple to an enterprise distribution premium. Additionally , we are in a structural gold rush for high-quality, legally compliant, longitudinal medical data to train vertical healthcare AI models. Large technology hyperscalers and pharmaceutical giants cannot simply scrape the internet for this; they need structured clinical inputs. Teladoc sits on one of the largest de-identified virtual medical datasets on earth. From the activist playbook , we’ll see Voss demand the immediate creation of a Data & Diagnostics Licensing Division, transforming a legacy liability into an incredibly high-margin, pure-software data asset that requires zero human clinician hours to scale. Chuck is doing great work and deserves credi5 for the Teledoc turnaround but it will be Travis Cocke who will be responsible for a share price way beyond your $15 valuation.
1
|0