
Advertisement
- Malaysia
- /
- Semiconductors
- /
- KLSE:MPI
Calculating The Intrinsic Value Of Malaysian Pacific Industries Berhad (KLSE:MPI)
Key Insights
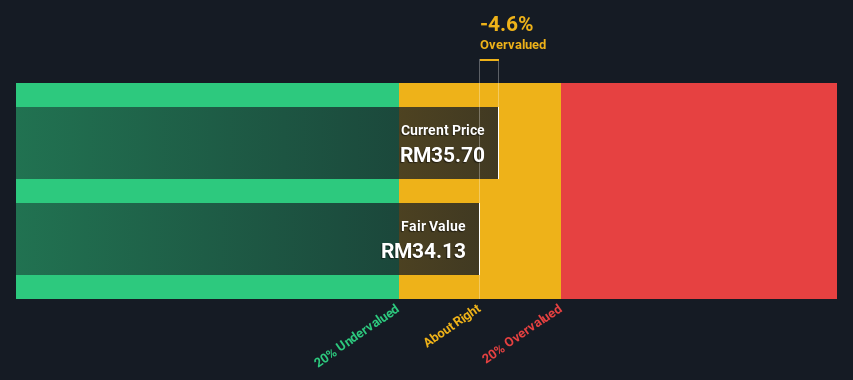
- The projected fair value for Malaysian Pacific Industries Berhad is RM34.13 based on 2 Stage Free Cash Flow to Equity
- Current share price of RM35.70 suggests Malaysian Pacific Industries Berhad is potentially trading close to its fair value
- Our fair value estimate is 17% lower than Malaysian Pacific Industries Berhad's analyst price target of RM41.18
In this article we are going to estimate the intrinsic value of Malaysian Pacific Industries Berhad (KLSE:MPI) by taking the expected future cash flows and discounting them to their present value. We will take advantage of the Discounted Cash Flow (DCF) model for this purpose. Don't get put off by the jargon, the math behind it is actually quite straightforward.
Remember though, that there are many ways to estimate a company's value, and a DCF is just one method. For those who are keen learners of equity analysis, the Simply Wall St analysis model here may be something of interest to you.
Check out our latest analysis for Malaysian Pacific Industries Berhad
Step By Step Through The Calculation
We are going to use a two-stage DCF model, which, as the name states, takes into account two stages of growth. The first stage is generally a higher growth period which levels off heading towards the terminal value, captured in the second 'steady growth' period. To start off with, we need to estimate the next ten years of cash flows. Where possible we use analyst estimates, but when these aren't available we extrapolate the previous free cash flow (FCF) from the last estimate or reported value. We assume companies with shrinking free cash flow will slow their rate of shrinkage, and that companies with growing free cash flow will see their growth rate slow, over this period. We do this to reflect that growth tends to slow more in the early years than it does in later years.
Generally we assume that a dollar today is more valuable than a dollar in the future, and so the sum of these future cash flows is then discounted to today's value:
10-year free cash flow (FCF) estimate
| 2025 | 2026 | 2027 | 2028 | 2029 | 2030 | 2031 | 2032 | 2033 | 2034 | |
| Levered FCF (MYR, Millions) | RM348.8m | RM421.1m | RM476.5m | RM525.5m | RM569.0m | RM607.9m | RM643.6m | RM676.8m | RM708.5m | RM739.3m |
| Growth Rate Estimate Source | Analyst x1 | Analyst x1 | Est @ 13.17% | Est @ 10.28% | Est @ 8.26% | Est @ 6.85% | Est @ 5.86% | Est @ 5.17% | Est @ 4.68% | Est @ 4.34% |
| Present Value (MYR, Millions) Discounted @ 11% | RM314 | RM342 | RM349 | RM347 | RM338 | RM326 | RM311 | RM294 | RM278 | RM261 |
("Est" = FCF growth rate estimated by Simply Wall St)
Present Value of 10-year Cash Flow (PVCF) = RM3.2b
After calculating the present value of future cash flows in the initial 10-year period, we need to calculate the Terminal Value, which accounts for all future cash flows beyond the first stage. For a number of reasons a very conservative growth rate is used that cannot exceed that of a country's GDP growth. In this case we have used the 5-year average of the 10-year government bond yield (3.6%) to estimate future growth. In the same way as with the 10-year 'growth' period, we discount future cash flows to today's value, using a cost of equity of 11%.
Terminal Value (TV)= FCF2034 × (1 + g) ÷ (r – g) = RM739m× (1 + 3.6%) ÷ (11%– 3.6%) = RM10b
Present Value of Terminal Value (PVTV)= TV / (1 + r)10= RM10b÷ ( 1 + 11%)10= RM3.6b
The total value, or equity value, is then the sum of the present value of the future cash flows, which in this case is RM6.8b. The last step is to then divide the equity value by the number of shares outstanding. Compared to the current share price of RM35.7, the company appears around fair value at the time of writing. The assumptions in any calculation have a big impact on the valuation, so it is better to view this as a rough estimate, not precise down to the last cent.
Important Assumptions
The calculation above is very dependent on two assumptions. The first is the discount rate and the other is the cash flows. You don't have to agree with these inputs, I recommend redoing the calculations yourself and playing with them. The DCF also does not consider the possible cyclicality of an industry, or a company's future capital requirements, so it does not give a full picture of a company's potential performance. Given that we are looking at Malaysian Pacific Industries Berhad as potential shareholders, the cost of equity is used as the discount rate, rather than the cost of capital (or weighted average cost of capital, WACC) which accounts for debt. In this calculation we've used 11%, which is based on a levered beta of 1.329. Beta is a measure of a stock's volatility, compared to the market as a whole. We get our beta from the industry average beta of globally comparable companies, with an imposed limit between 0.8 and 2.0, which is a reasonable range for a stable business.
SWOT Analysis for Malaysian Pacific Industries Berhad
Strength
- Debt is not viewed as a risk.
- Dividends are covered by earnings and cash flows.
Weakness
- Earnings declined over the past year.
- Dividend is low compared to the top 25% of dividend payers in the Semiconductor market.
Opportunity
- Annual earnings are forecast to grow faster than the Malaysian market.
- Good value based on P/E ratio compared to estimated Fair P/E ratio.
Threat
- Revenue is forecast to grow slower than 20% per year.
Looking Ahead:
Whilst important, the DCF calculation is only one of many factors that you need to assess for a company. The DCF model is not a perfect stock valuation tool. Instead the best use for a DCF model is to test certain assumptions and theories to see if they would lead to the company being undervalued or overvalued. If a company grows at a different rate, or if its cost of equity or risk free rate changes sharply, the output can look very different. For Malaysian Pacific Industries Berhad, we've put together three fundamental items you should further examine:
- Financial Health: Does MPI have a healthy balance sheet? Take a look at our free balance sheet analysis with six simple checks on key factors like leverage and risk.
- Future Earnings: How does MPI's growth rate compare to its peers and the wider market? Dig deeper into the analyst consensus number for the upcoming years by interacting with our free analyst growth expectation chart.
- Other High Quality Alternatives: Do you like a good all-rounder? Explore our interactive list of high quality stocks to get an idea of what else is out there you may be missing!
PS. Simply Wall St updates its DCF calculation for every Malaysian stock every day, so if you want to find the intrinsic value of any other stock just search here.
New: Manage All Your Stock Portfolios in One Place
We've created the ultimate portfolio companion for stock investors, and it's free.
• Connect an unlimited number of Portfolios and see your total in one currency
• Be alerted to new Warning Signs or Risks via email or mobile
• Track the Fair Value of your stocks
Have feedback on this article? Concerned about the content? Get in touch with us directly. Alternatively, email editorial-team (at) simplywallst.com.
This article by Simply Wall St is general in nature. We provide commentary based on historical data and analyst forecasts only using an unbiased methodology and our articles are not intended to be financial advice. It does not constitute a recommendation to buy or sell any stock, and does not take account of your objectives, or your financial situation. We aim to bring you long-term focused analysis driven by fundamental data. Note that our analysis may not factor in the latest price-sensitive company announcements or qualitative material. Simply Wall St has no position in any stocks mentioned.
About KLSE:MPI
Malaysian Pacific Industries Berhad
An investment holding company, engages in the manufacturing, assembling, testing, marketing, and sale of integrated circuits, semiconductor devices, electronic components, and lead frames.
Excellent balance sheet and slightly overvalued.
Market Insights

Advertisement
Community Narratives
MicroVision will explode future revenue by 380.37% with a vision towards success
Fair Value US$60.00|98.4% undervalued
TH
Community Contributor
The Indispensable Artery for a New North American Economy
Fair Value CA$132.87|1.3% undervalued
TI
Community Contributor