
Advertisement
- Malaysia
- /
- Specialty Stores
- /
- KLSE:KAMDAR
Kamdar Group (M) Berhad (KLSE:KAMDAR) Has Debt But No Earnings; Should You Worry?
Warren Buffett famously said, 'Volatility is far from synonymous with risk.' When we think about how risky a company is, we always like to look at its use of debt, since debt overload can lead to ruin. We can see that Kamdar Group (M) Berhad (KLSE:KAMDAR) does use debt in its business. But is this debt a concern to shareholders?
When Is Debt A Problem?
Debt is a tool to help businesses grow, but if a business is incapable of paying off its lenders, then it exists at their mercy. In the worst case scenario, a company can go bankrupt if it cannot pay its creditors. However, a more usual (but still expensive) situation is where a company must dilute shareholders at a cheap share price simply to get debt under control. Of course, the upside of debt is that it often represents cheap capital, especially when it replaces dilution in a company with the ability to reinvest at high rates of return. When we examine debt levels, we first consider both cash and debt levels, together.
View our latest analysis for Kamdar Group (M) Berhad
What Is Kamdar Group (M) Berhad's Net Debt?
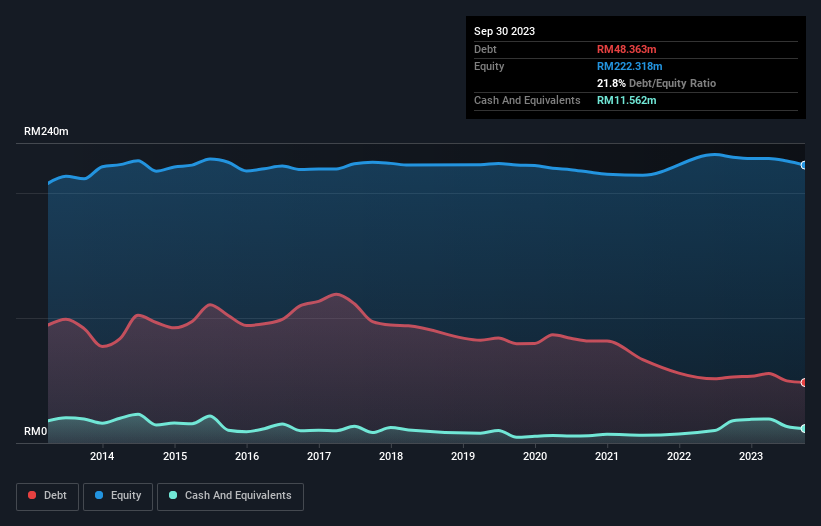
As you can see below, Kamdar Group (M) Berhad had RM48.4m of debt at September 2023, down from RM52.9m a year prior. However, it does have RM11.6m in cash offsetting this, leading to net debt of about RM36.8m.
How Strong Is Kamdar Group (M) Berhad's Balance Sheet?
According to the last reported balance sheet, Kamdar Group (M) Berhad had liabilities of RM23.1m due within 12 months, and liabilities of RM37.9m due beyond 12 months. Offsetting this, it had RM11.6m in cash and RM6.59m in receivables that were due within 12 months. So its liabilities total RM42.9m more than the combination of its cash and short-term receivables.
When you consider that this deficiency exceeds the company's RM33.7m market capitalization, you might well be inclined to review the balance sheet intently. In the scenario where the company had to clean up its balance sheet quickly, it seems likely shareholders would suffer extensive dilution. When analysing debt levels, the balance sheet is the obvious place to start. But it is Kamdar Group (M) Berhad's earnings that will influence how the balance sheet holds up in the future. So if you're keen to discover more about its earnings, it might be worth checking out this graph of its long term earnings trend.
In the last year Kamdar Group (M) Berhad had a loss before interest and tax, and actually shrunk its revenue by 11%, to RM66m. That's not what we would hope to see.
Caveat Emptor
Not only did Kamdar Group (M) Berhad's revenue slip over the last twelve months, but it also produced negative earnings before interest and tax (EBIT). Its EBIT loss was a whopping RM3.9m. Considering that alongside the liabilities mentioned above make us nervous about the company. It would need to improve its operations quickly for us to be interested in it. It's fair to say the loss of RM6.3m didn't encourage us either; we'd like to see a profit. In the meantime, we consider the stock to be risky. When analysing debt levels, the balance sheet is the obvious place to start. But ultimately, every company can contain risks that exist outside of the balance sheet. We've identified 2 warning signs with Kamdar Group (M) Berhad , and understanding them should be part of your investment process.
If, after all that, you're more interested in a fast growing company with a rock-solid balance sheet, then check out our list of net cash growth stocks without delay.
Valuation is complex, but we're here to simplify it.
Discover if Kamdar Group (M) Berhad might be undervalued or overvalued with our detailed analysis, featuring fair value estimates, potential risks, dividends, insider trades, and its financial condition.
Access Free AnalysisHave feedback on this article? Concerned about the content? Get in touch with us directly. Alternatively, email editorial-team (at) simplywallst.com.
This article by Simply Wall St is general in nature. We provide commentary based on historical data and analyst forecasts only using an unbiased methodology and our articles are not intended to be financial advice. It does not constitute a recommendation to buy or sell any stock, and does not take account of your objectives, or your financial situation. We aim to bring you long-term focused analysis driven by fundamental data. Note that our analysis may not factor in the latest price-sensitive company announcements or qualitative material. Simply Wall St has no position in any stocks mentioned.
About KLSE:KAMDAR
Kamdar Group (M) Berhad
An investment holding company, engages in the import, export, retail, and wholesale of textile and textile-based products in Malaysia.
Flawless balance sheet with low risk.
Market Insights

Advertisement
Community Narratives
MicroVision will explode future revenue by 380.37% with a vision towards success
Fair Value US$60.00|98.4% undervalued
TH
Community Contributor
The Indispensable Artery for a New North American Economy
Fair Value CA$132.87|1.3% undervalued
TI
Community Contributor