
Advertisement
Howard Marks put it nicely when he said that, rather than worrying about share price volatility, 'The possibility of permanent loss is the risk I worry about... and every practical investor I know worries about.' When we think about how risky a company is, we always like to look at its use of debt, since debt overload can lead to ruin. We can see that Kamdar Group (M) Berhad (KLSE:KAMDAR) does use debt in its business. But the real question is whether this debt is making the company risky.
When Is Debt A Problem?
Debt and other liabilities become risky for a business when it cannot easily fulfill those obligations, either with free cash flow or by raising capital at an attractive price. Part and parcel of capitalism is the process of 'creative destruction' where failed businesses are mercilessly liquidated by their bankers. However, a more usual (but still expensive) situation is where a company must dilute shareholders at a cheap share price simply to get debt under control. Of course, the upside of debt is that it often represents cheap capital, especially when it replaces dilution in a company with the ability to reinvest at high rates of return. When we think about a company's use of debt, we first look at cash and debt together.
View our latest analysis for Kamdar Group (M) Berhad
How Much Debt Does Kamdar Group (M) Berhad Carry?
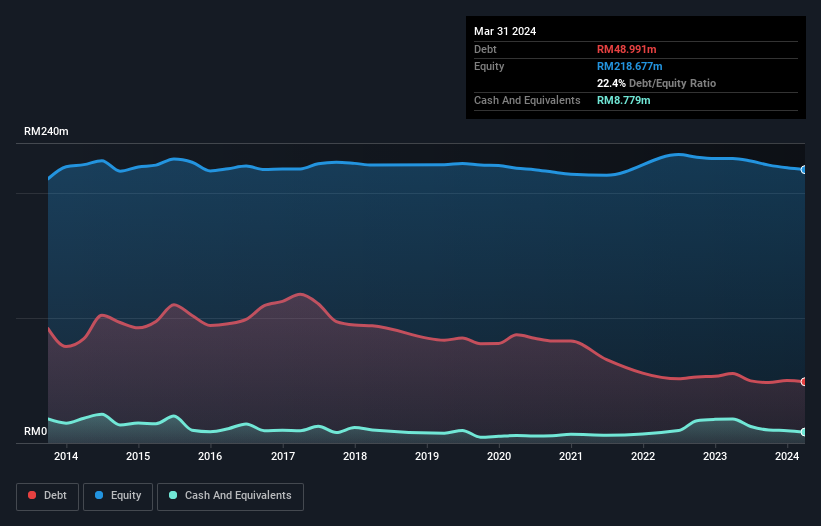
The image below, which you can click on for greater detail, shows that Kamdar Group (M) Berhad had debt of RM49.0m at the end of March 2024, a reduction from RM55.5m over a year. However, it does have RM8.78m in cash offsetting this, leading to net debt of about RM40.2m.
A Look At Kamdar Group (M) Berhad's Liabilities
Zooming in on the latest balance sheet data, we can see that Kamdar Group (M) Berhad had liabilities of RM24.6m due within 12 months and liabilities of RM35.8m due beyond that. On the other hand, it had cash of RM8.78m and RM6.95m worth of receivables due within a year. So its liabilities total RM44.7m more than the combination of its cash and short-term receivables.
This deficit is considerable relative to its market capitalization of RM59.4m, so it does suggest shareholders should keep an eye on Kamdar Group (M) Berhad's use of debt. Should its lenders demand that it shore up the balance sheet, shareholders would likely face severe dilution. There's no doubt that we learn most about debt from the balance sheet. But you can't view debt in total isolation; since Kamdar Group (M) Berhad will need earnings to service that debt. So if you're keen to discover more about its earnings, it might be worth checking out this graph of its long term earnings trend.
Over 12 months, Kamdar Group (M) Berhad made a loss at the EBIT level, and saw its revenue drop to RM61m, which is a fall of 19%. That's not what we would hope to see.
Caveat Emptor
While Kamdar Group (M) Berhad's falling revenue is about as heartwarming as a wet blanket, arguably its earnings before interest and tax (EBIT) loss is even less appealing. Its EBIT loss was a whopping RM6.6m. When we look at that and recall the liabilities on its balance sheet, relative to cash, it seems unwise to us for the company to have any debt. Quite frankly we think the balance sheet is far from match-fit, although it could be improved with time. We would feel better if it turned its trailing twelve month loss of RM9.0m into a profit. So we do think this stock is quite risky. The balance sheet is clearly the area to focus on when you are analysing debt. But ultimately, every company can contain risks that exist outside of the balance sheet. For example, we've discovered 3 warning signs for Kamdar Group (M) Berhad (2 are a bit concerning!) that you should be aware of before investing here.
If, after all that, you're more interested in a fast growing company with a rock-solid balance sheet, then check out our list of net cash growth stocks without delay.
Valuation is complex, but we're here to simplify it.
Discover if Kamdar Group (M) Berhad might be undervalued or overvalued with our detailed analysis, featuring fair value estimates, potential risks, dividends, insider trades, and its financial condition.
Access Free AnalysisHave feedback on this article? Concerned about the content? Get in touch with us directly. Alternatively, email editorial-team (at) simplywallst.com.
This article by Simply Wall St is general in nature. We provide commentary based on historical data and analyst forecasts only using an unbiased methodology and our articles are not intended to be financial advice. It does not constitute a recommendation to buy or sell any stock, and does not take account of your objectives, or your financial situation. We aim to bring you long-term focused analysis driven by fundamental data. Note that our analysis may not factor in the latest price-sensitive company announcements or qualitative material. Simply Wall St has no position in any stocks mentioned.
About KLSE:KAMDAR
Kamdar Group (M) Berhad
An investment holding company, engages in the import, export, retail, and wholesale of textile and textile-based products in Malaysia.
Flawless balance sheet with low risk.
Market Insights

Advertisement
Community Narratives
MicroVision will explode future revenue by 380.37% with a vision towards success
Fair Value US$60.00|98.5% undervalued
TH
Community Contributor
The Indispensable Artery for a New North American Economy
Fair Value CA$132.87|2.3% undervalued
TI
Community Contributor