
Advertisement
- Malaysia
- /
- Specialty Stores
- /
- KLSE:KAMDAR
Capital Allocation Trends At Kamdar Group (M) Berhad (KLSE:KAMDAR) Aren't Ideal
Ignoring the stock price of a company, what are the underlying trends that tell us a business is past the growth phase? More often than not, we'll see a declining return on capital employed (ROCE) and a declining amount of capital employed. This indicates the company is producing less profit from its investments and its total assets are decreasing. And from a first read, things don't look too good at Kamdar Group (M) Berhad (KLSE:KAMDAR), so let's see why.
What Is Return On Capital Employed (ROCE)?
For those that aren't sure what ROCE is, it measures the amount of pre-tax profits a company can generate from the capital employed in its business. Analysts use this formula to calculate it for Kamdar Group (M) Berhad:
Return on Capital Employed = Earnings Before Interest and Tax (EBIT) ÷ (Total Assets - Current Liabilities)
0.0029 = RM784k ÷ (RM295m - RM28m) (Based on the trailing twelve months to March 2023).
So, Kamdar Group (M) Berhad has an ROCE of 0.3%. In absolute terms, that's a low return and it also under-performs the Specialty Retail industry average of 19%.
See our latest analysis for Kamdar Group (M) Berhad
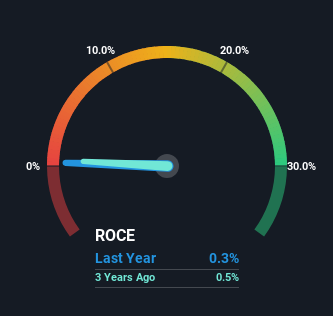
Historical performance is a great place to start when researching a stock so above you can see the gauge for Kamdar Group (M) Berhad's ROCE against it's prior returns. If you want to delve into the historical earnings, revenue and cash flow of Kamdar Group (M) Berhad, check out these free graphs here.
What Can We Tell From Kamdar Group (M) Berhad's ROCE Trend?
In terms of Kamdar Group (M) Berhad's historical ROCE movements, the trend doesn't inspire confidence. Unfortunately the returns on capital have diminished from the 2.4% that they were earning five years ago. And on the capital employed front, the business is utilizing roughly the same amount of capital as it was back then. Since returns are falling and the business has the same amount of assets employed, this can suggest it's a mature business that hasn't had much growth in the last five years. If these trends continue, we wouldn't expect Kamdar Group (M) Berhad to turn into a multi-bagger.
The Bottom Line
In the end, the trend of lower returns on the same amount of capital isn't typically an indication that we're looking at a growth stock. Investors haven't taken kindly to these developments, since the stock has declined 55% from where it was five years ago. That being the case, unless the underlying trends revert to a more positive trajectory, we'd consider looking elsewhere.
Kamdar Group (M) Berhad does come with some risks though, we found 3 warning signs in our investment analysis, and 2 of those make us uncomfortable...
For those who like to invest in solid companies, check out this free list of companies with solid balance sheets and high returns on equity.
Valuation is complex, but we're here to simplify it.
Discover if Kamdar Group (M) Berhad might be undervalued or overvalued with our detailed analysis, featuring fair value estimates, potential risks, dividends, insider trades, and its financial condition.
Access Free AnalysisHave feedback on this article? Concerned about the content? Get in touch with us directly. Alternatively, email editorial-team (at) simplywallst.com.
This article by Simply Wall St is general in nature. We provide commentary based on historical data and analyst forecasts only using an unbiased methodology and our articles are not intended to be financial advice. It does not constitute a recommendation to buy or sell any stock, and does not take account of your objectives, or your financial situation. We aim to bring you long-term focused analysis driven by fundamental data. Note that our analysis may not factor in the latest price-sensitive company announcements or qualitative material. Simply Wall St has no position in any stocks mentioned.
About KLSE:KAMDAR
Kamdar Group (M) Berhad
An investment holding company, engages in the import, export, retail, and wholesale of textile and textile-based products in Malaysia.
Flawless balance sheet with low risk.
Market Insights

Advertisement
Community Narratives
MicroVision will explode future revenue by 380.37% with a vision towards success
Fair Value US$60.00|98.5% undervalued
TH
Community Contributor
The Indispensable Artery for a New North American Economy
Fair Value CA$132.87|2.3% undervalued
TI
Community Contributor