Stock Analysis
- Malaysia
- /
- Real Estate
- /
- KLSE:SPSETIA
S P Setia Berhad (KLSE:SPSETIA) earnings and shareholder returns have been trending downwards for the last five years, but the stock lifts 8.8% this past week

S P Setia Berhad (KLSE:SPSETIA) shareholders should be happy to see the share price up 17% in the last month. But that doesn't change the fact that the returns over the last half decade have been disappointing. In fact, the share price has declined rather badly, down some 59% in that time. Some might say the recent bounce is to be expected after such a bad drop. However, in the best case scenario (far from fait accompli), this improved performance might be sustained.
The recent uptick of 8.8% could be a positive sign of things to come, so let's take a look at historical fundamentals.
View our latest analysis for S P Setia Berhad
In his essay The Superinvestors of Graham-and-Doddsville Warren Buffett described how share prices do not always rationally reflect the value of a business. By comparing earnings per share (EPS) and share price changes over time, we can get a feel for how investor attitudes to a company have morphed over time.
During five years of share price growth, S P Setia Berhad moved from a loss to profitability. Most would consider that to be a good thing, so it's counter-intuitive to see the share price declining. Other metrics may better explain the share price move.
We don't think that the 1.7% is big factor in the share price, since it's quite small, as dividends go. Revenue is actually up 3.3% over the time period. So it seems one might have to take closer look at the fundamentals to understand why the share price languishes. After all, there may be an opportunity.
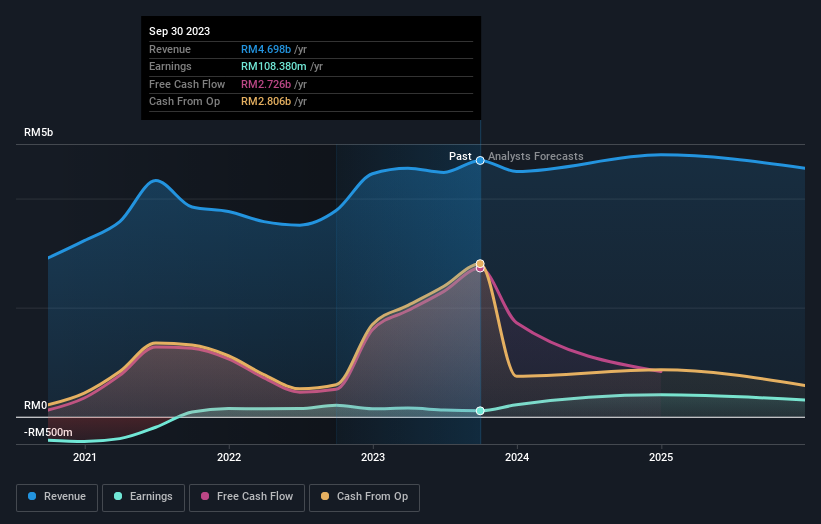
The company's revenue and earnings (over time) are depicted in the image below (click to see the exact numbers).
S P Setia Berhad is well known by investors, and plenty of clever analysts have tried to predict the future profit levels. So we recommend checking out this free report showing consensus forecasts
What About Dividends?
It is important to consider the total shareholder return, as well as the share price return, for any given stock. Whereas the share price return only reflects the change in the share price, the TSR includes the value of dividends (assuming they were reinvested) and the benefit of any discounted capital raising or spin-off. It's fair to say that the TSR gives a more complete picture for stocks that pay a dividend. As it happens, S P Setia Berhad's TSR for the last 5 years was -57%, which exceeds the share price return mentioned earlier. The dividends paid by the company have thusly boosted the total shareholder return.
A Different Perspective
It's nice to see that S P Setia Berhad shareholders have received a total shareholder return of 48% over the last year. And that does include the dividend. There's no doubt those recent returns are much better than the TSR loss of 9% per year over five years. This makes us a little wary, but the business might have turned around its fortunes. I find it very interesting to look at share price over the long term as a proxy for business performance. But to truly gain insight, we need to consider other information, too. Like risks, for instance. Every company has them, and we've spotted 3 warning signs for S P Setia Berhad (of which 1 is concerning!) you should know about.
But note: S P Setia Berhad may not be the best stock to buy. So take a peek at this free list of interesting companies with past earnings growth (and further growth forecast).
Please note, the market returns quoted in this article reflect the market weighted average returns of stocks that currently trade on Malaysian exchanges.
Valuation is complex, but we're helping make it simple.
Find out whether S P Setia Berhad is potentially over or undervalued by checking out our comprehensive analysis, which includes fair value estimates, risks and warnings, dividends, insider transactions and financial health.
View the Free AnalysisHave feedback on this article? Concerned about the content? Get in touch with us directly. Alternatively, email editorial-team (at) simplywallst.com.
This article by Simply Wall St is general in nature. We provide commentary based on historical data and analyst forecasts only using an unbiased methodology and our articles are not intended to be financial advice. It does not constitute a recommendation to buy or sell any stock, and does not take account of your objectives, or your financial situation. We aim to bring you long-term focused analysis driven by fundamental data. Note that our analysis may not factor in the latest price-sensitive company announcements or qualitative material. Simply Wall St has no position in any stocks mentioned.
About KLSE:SPSETIA
S P Setia Berhad
S P Setia Berhad, an investment holding company, operates as a property development and investment company in Malaysia, Singapore, Australia, Vietnam, Japan, and the United Kingdom.
Excellent balance sheet with proven track record.

