
Advertisement
- Malaysia
- /
- Interactive Media and Services
- /
- KLSE:CATCHA
Catcha Digital Berhad (KLSE:CATCHA) Shareholders Will Want The ROCE Trajectory To Continue
If we want to find a stock that could multiply over the long term, what are the underlying trends we should look for? Ideally, a business will show two trends; firstly a growing return on capital employed (ROCE) and secondly, an increasing amount of capital employed. Ultimately, this demonstrates that it's a business that is reinvesting profits at increasing rates of return. So when we looked at Catcha Digital Berhad (KLSE:CATCHA) and its trend of ROCE, we really liked what we saw.
Return On Capital Employed (ROCE): What Is It?
Just to clarify if you're unsure, ROCE is a metric for evaluating how much pre-tax income (in percentage terms) a company earns on the capital invested in its business. The formula for this calculation on Catcha Digital Berhad is:
Return on Capital Employed = Earnings Before Interest and Tax (EBIT) ÷ (Total Assets - Current Liabilities)
0.057 = RM3.3m ÷ (RM70m - RM12m) (Based on the trailing twelve months to December 2023).
Therefore, Catcha Digital Berhad has an ROCE of 5.7%. Ultimately, that's a low return and it under-performs the Interactive Media and Services industry average of 12%.
See our latest analysis for Catcha Digital Berhad
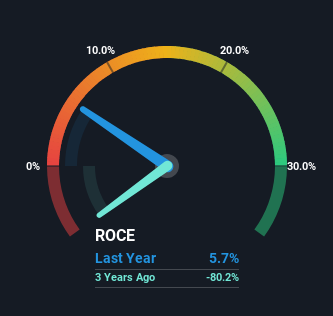
Historical performance is a great place to start when researching a stock so above you can see the gauge for Catcha Digital Berhad's ROCE against it's prior returns. If you're interested in investigating Catcha Digital Berhad's past further, check out this free graph covering Catcha Digital Berhad's past earnings, revenue and cash flow.
What Does the ROCE Trend For Catcha Digital Berhad Tell Us?
We're delighted to see that Catcha Digital Berhad is reaping rewards from its investments and is now generating some pre-tax profits. Shareholders would no doubt be pleased with this because the business was loss-making five years ago but is is now generating 5.7% on its capital. In addition to that, Catcha Digital Berhad is employing 783% more capital than previously which is expected of a company that's trying to break into profitability. This can indicate that there's plenty of opportunities to invest capital internally and at ever higher rates, both common traits of a multi-bagger.
For the record though, there was a noticeable increase in the company's current liabilities over the period, so we would attribute some of the ROCE growth to that. The current liabilities has increased to 17% of total assets, so the business is now more funded by the likes of its suppliers or short-term creditors. Keep an eye out for future increases because when the ratio of current liabilities to total assets gets particularly high, this can introduce some new risks for the business.
The Bottom Line On Catcha Digital Berhad's ROCE
To the delight of most shareholders, Catcha Digital Berhad has now broken into profitability. And investors seem to expect more of this going forward, since the stock has rewarded shareholders with a 56% return over the last five years. So given the stock has proven it has promising trends, it's worth researching the company further to see if these trends are likely to persist.
One final note, you should learn about the 3 warning signs we've spotted with Catcha Digital Berhad (including 1 which makes us a bit uncomfortable) .
While Catcha Digital Berhad may not currently earn the highest returns, we've compiled a list of companies that currently earn more than 25% return on equity. Check out this free list here.
New: AI Stock Screener & Alerts
Our new AI Stock Screener scans the market every day to uncover opportunities.
• Dividend Powerhouses (3%+ Yield)
• Undervalued Small Caps with Insider Buying
• High growth Tech and AI Companies
Or build your own from over 50 metrics.
Have feedback on this article? Concerned about the content? Get in touch with us directly. Alternatively, email editorial-team (at) simplywallst.com.
This article by Simply Wall St is general in nature. We provide commentary based on historical data and analyst forecasts only using an unbiased methodology and our articles are not intended to be financial advice. It does not constitute a recommendation to buy or sell any stock, and does not take account of your objectives, or your financial situation. We aim to bring you long-term focused analysis driven by fundamental data. Note that our analysis may not factor in the latest price-sensitive company announcements or qualitative material. Simply Wall St has no position in any stocks mentioned.
About KLSE:CATCHA
Catcha Digital Berhad
An investment holding company, provides digital media advertising services for brand owners and advertising agencies in Malaysia.
Flawless balance sheet with proven track record.
Market Insights

Advertisement
Community Narratives
The company that turned a verb into a global necessity and basically runs the modern internet, digital ads, smartphones, maps, and AI.
Fair Value US$300.00|5.2% undervalued
OS
Community Contributor
Flowers Foods Pays A Fair Price For Health
Fair Value US$16.12|24.9% undervalued
NV
Community Contributor
TMX Group will thrive with 33.3% profit margin and enduring market moat
Fair Value CA$49.90|3.3% overvalued
LI
Community Contributor
The "Molecular Pencil": Why Beam's Technology is Built to Win
Fair Value US$65.01|64.5% undervalued
DA
Community Contributor